
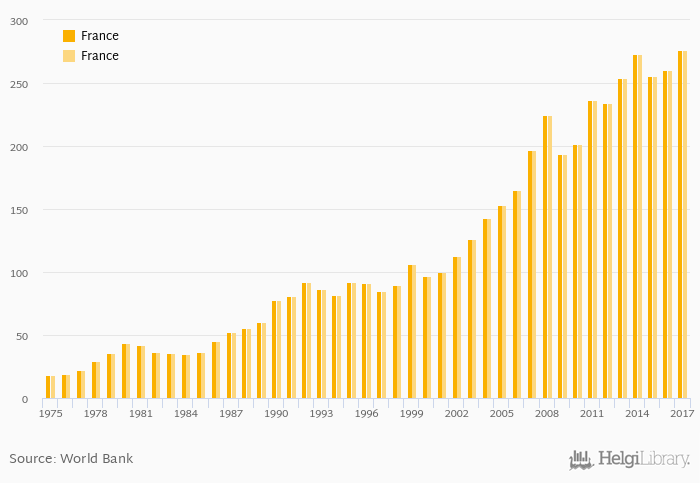
Exports of services as a part of balance of payment rose 6.10% to USD 276 bil in France in 2017, according to the National Statistical Office.
Historically, exports of services as a part of balance of payment in France reached an all time high of USD 276 bil in 2017 and an all time low of USD 18.0 bil in 1975. When compared to France's main peers, exports of services as a part of balance of payment in Belgium amounted to USD 120 bil, USD 309 bil in Germany, USD 112 bil in Italy and USD 139 bil in Spain in 2017.
France has been ranked 4th within the group of 154 countries we follow in terms of exports of services as a part of balance of payment.
| Exports of Services (BoP, USD) | Unit | 2001 | 2002 | 2003 | 2004 | 2005 | 2006 | 2007 | 2008 | 2009 | 2010 | 2011 | 2012 | 2013 | 2014 | 2015 | 2016 | 2017 | 2018 | 2019 | 2020 | 2021 |
| Austria | USD bil | 59.1 | 61.4 | 67.1 | 75.9 | 76.7 | ||||||||||||||||
| Belgium | USD bil | ... | 109 | 109 | 118 | 124 | 124 | |||||||||||||||
| France | USD bil | 256 | 259 | 275 | 302 | 296 | ||||||||||||||||
| Germany | USD bil | 281 | 293 | 322 | 357 | 356 | ||||||||||||||||
| Italy | USD bil | 98.3 | 101 | 113 | 123 | 122 | ||||||||||||||||
| Luxembourg | USD bil | 93.5 | 94.1 | 101 | 109 | 113 | ||||||||||||||||
| Morocco | USD bil | 14.7 | 15.3 | 17.3 | 18.6 | 19.4 | ||||||||||||||||
| Netherlands | USD bil | 169 | 158 | 175 | 201 | 202 | ||||||||||||||||
| Poland | USD bil | 44.1 | 48.7 | 57.9 | 68.1 | 70.2 | ||||||||||||||||
| Portugal | USD bil | 27.6 | 29.4 | 35.0 | 39.4 | 40.0 | ||||||||||||||||
| Slovenia | USD bil | 6.60 | 7.21 | 8.39 | 9.57 | 9.69 | ||||||||||||||||
| Spain | USD bil | 121 | 131 | 144 | 155 | 157 | ||||||||||||||||
| Switzerland | USD bil | 125 | 127 | 129 | 139 | 136 |
 Helgi Library


