
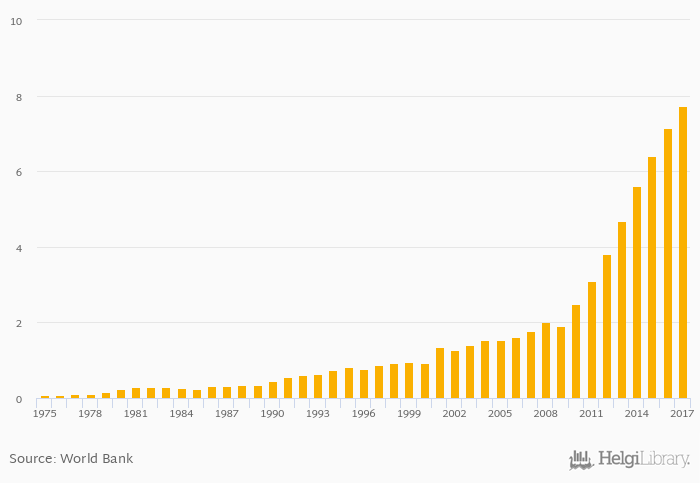
Exports of services as a part of balance of payment rose 8.71% to USD 7.76 bil in Sri Lanka in 2017, according to the National Statistical Office.
Historically, exports of services as a part of balance of payment in Sri Lanka reached an all time high of USD 7.76 bil in 2017 and an all time low of USD 0.073 bil in 1976. When compared to Sri Lanka's main peers, exports of services as a part of balance of payment in India amounted to USD 185 bil, USD 37.1 bil in Malaysia, USD 2.97 bil in Maldives and USD 3.85 bil in Myanmar in 2017.
Sri Lanka has been ranked 65th within the group of 154 countries we follow in terms of exports of services as a part of balance of payment, 23 places above the position seen 10 years ago.
| Exports of Services (BoP, USD) | Unit | 2001 | 2002 | 2003 | 2004 | 2005 | 2006 | 2007 | 2008 | 2009 | 2010 | 2011 | 2012 | 2013 | 2014 | 2015 | 2016 | 2017 | 2018 | 2019 | 2020 | 2021 |
| Bangladesh | USD bil | 3.23 | 3.54 | 3.87 | 5.45 | 6.21 | ||||||||||||||||
| Cambodia | USD bil | 3.95 | 4.03 | 4.61 | 5.45 | 6.09 | ||||||||||||||||
| China | USD bil | 217 | 208 | 213 | 234 | 244 | ||||||||||||||||
| India | USD bil | 156 | 162 | 185 | 205 | 215 | ||||||||||||||||
| Indonesia | USD bil | 22.2 | 23.3 | 25.3 | 31.2 | 31.6 | ||||||||||||||||
| Laos | USD bil | 0.844 | 0.835 | 0.781 | 0.985 | 1.18 | ||||||||||||||||
| Malaysia | USD bil | 34.9 | 35.6 | 37.1 | 40.2 | 41.1 | ||||||||||||||||
| Maldives | USD bil | 2.91 | 2.89 | 3.00 | 3.25 | 3.38 | ||||||||||||||||
| Myanmar | USD bil | 3.75 | 3.78 | 3.82 | 4.65 | 6.68 | ... | ... | ||||||||||||||
| Pakistan | USD bil | 5.90 | 5.05 | 6.33 | 5.93 | 5.87 | ||||||||||||||||
| Singapore | USD bil | 153 | 152 | 171 | 205 | 216 | ||||||||||||||||
| Sri Lanka | USD bil | 6.40 | 7.14 | 7.72 | 8.37 | 7.47 | ... | |||||||||||||||
| Thailand | USD bil | 58.1 | 63.8 | 71.0 | 77.5 | 81.2 | ||||||||||||||||
| Vietnam | USD bil | 11.3 | 12.5 | 13.1 | 14.8 | 16.6 |
 Helgi Library


