Follow us for the latest automotive news.
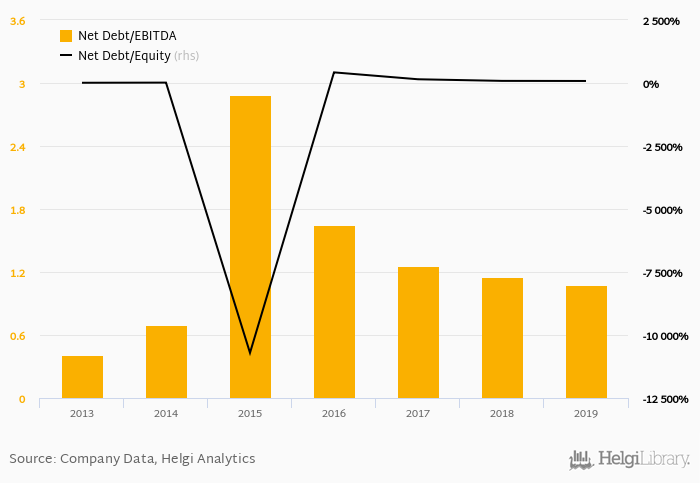
Ferrari's net debt stood at EUR 1,192 mil and accounted for 80.1% of equity at the end of 2019. The ratio is down 3.59 pp compared to the previous year.
Historically, the firm’s net debt to equity reached a high of 422% in 2016 and a low of -10,708% in 2015 between 2013 and 2019. The average for the last five years was -1,995%.
Net debt to EBITDA was calculated at 1.07x at the end of the year. That is up from 0.697x seen in 2014. The ratio reached a high of 2.89x in 2015 and a low of 0.406x in 2013.
The company’s cost of funding amounted to 1.55% in 2019, up which is above the 5-year of 1.47%. Funding costs have “eaten” some 3.38% of the operating profit generated in 2019.
You can see all the company’s data at Ferrari profile, or you can download a report on the company in the report section.
 Helgi Library