
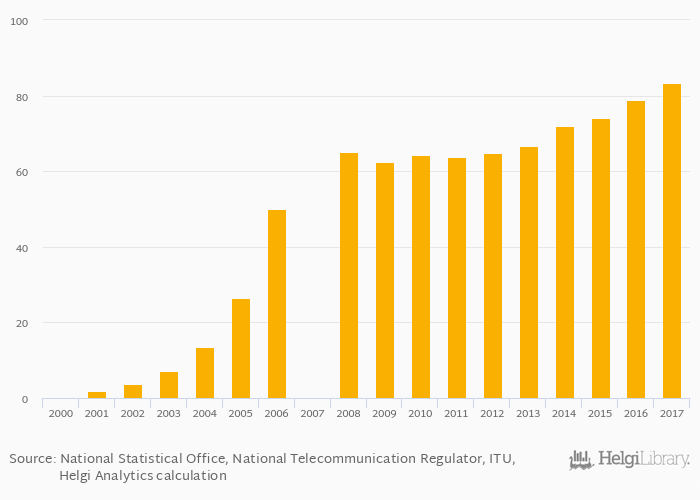
Fixed broadband internet lines per household rose 5.69% to 83.4% in Australia in 2017, according to World Bank.
Historically, fixed broadband internet lines per household in Australia reached an all time high of 83.4% in 2017 and an all time low of 0% in 2000.
Australia has been ranked 23rd within the group of 104 countries we follow in terms of fixed broadband internet lines per household, 88 places above the position seen 10 years ago.
| Fixed Broadband Internet Lines Per Household | Unit | 1997 | 1998 | 1999 | 2000 | 2001 | 2002 | 2003 | 2004 | 2005 | 2006 | 2007 | 2008 | 2009 | 2010 | 2011 | 2012 | 2013 | 2014 | 2015 | 2016 | 2017 |
| Australia | % | ... | ... | ... | 63.8% | 64.9% | 66.8% | 72.0% | 74.2% | |||||||||||||
| Cambodia | % | ... | ... | ... | 0.725% | 0.959% | 1.03% | 2.05% | 2.54% | |||||||||||||
| Indonesia | % | ... | ... | ... | 4.39% | 4.69% | 5.02% | 5.16% | 5.94% | |||||||||||||
| Malaysia | % | ... | ... | ... | 37.6% | 43.0% | 42.5% | 43.5% | 42.7% | |||||||||||||
| New Zealand | % | ... | ... | ... | 73.9% | 78.6% | 80.1% | 84.6% | 85.8% | |||||||||||||
| Papua New Guinea | % | ... | ... | ... | ... | ... | ... | ... | ... | ... | ... | ... | ... | ... | ... | ... | ... | ... | ... | ... | ... | ... |
| Philippines | % | ... | ... | ... | 8.86% | 10.4% | 12.2% | 13.5% | 13.3% | |||||||||||||
| Singapore | % | ... | ... | ... | 123% | 123% | 125% | 122% | 120% | |||||||||||||
| Thailand | % | ... | ... | ... | 19.1% | 22.2% | 25.4% | 26.6% | 30.4% | |||||||||||||
| Vietnam | % | ... | ... | ... | 16.2% | 19.6% | 20.6% | 23.4% | 29.1% |
 Helgi Library


