
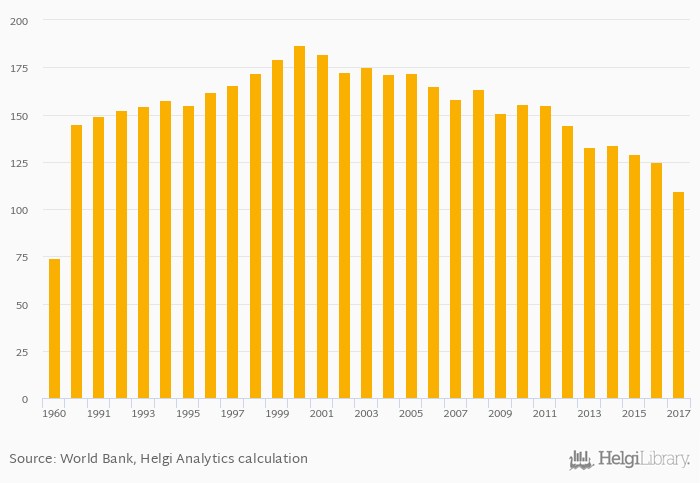
Fixed lines per household fell 12.3% to 110% in Iceland in 2017, according to World Bank.
Historically, fixed lines per household in Iceland reached an all time high of 187% in 2000 and an all time low of 74.3% in 1960. When compared to Iceland's main peers, fixed lines per household in Denmark amounted to 54.1%, 30.7% in Norway, 57.7% in Sweden and 118% in United Kingdom in 2017.
Iceland has been ranked 16th within the group of 103 countries we follow in terms of fixed lines per household, 10 places below the position seen 10 years ago.
| Fixed Lines Per Household | Unit | 1997 | 1998 | 1999 | 2000 | 2001 | 2002 | 2003 | 2004 | 2005 | 2006 | 2007 | 2008 | 2009 | 2010 | 2011 | 2012 | 2013 | 2014 | 2015 | 2016 | 2017 |
| Belgium | % | 99.8% | 99.3% | 97.8% | 96.2% | 94.8% | ||||||||||||||||
| Denmark | % | 95.7% | 88.2% | 80.0% | 71.2% | 64.2% | ||||||||||||||||
| Finland | % | 42.3% | 34.6% | 29.0% | 24.5% | 20.4% | ||||||||||||||||
| France | % | 141% | 138% | 136% | 134% | 134% | ||||||||||||||||
| Germany | % | 127% | 124% | 120% | 116% | 111% | ||||||||||||||||
| Iceland | % | 155% | 144% | 133% | 134% | 129% | ||||||||||||||||
| Ireland | % | 124% | 119% | 119% | 116% | 110% | ||||||||||||||||
| Netherlands | % | 96.7% | 96.8% | 95.4% | 92.5% | 92.0% | ||||||||||||||||
| Norway | % | 68.1% | 61.6% | 53.8% | 46.4% | 40.0% | ||||||||||||||||
| Russia | % | 84.1% | 80.3% | 77.1% | 72.7% | 67.7% | ||||||||||||||||
| Sweden | % | 95.6% | 88.5% | 82.9% | 79.3% | 74.2% | ||||||||||||||||
| United Kingdom | % | 125% | 124% | 123% | 122% | 120% |
 Helgi Library


