
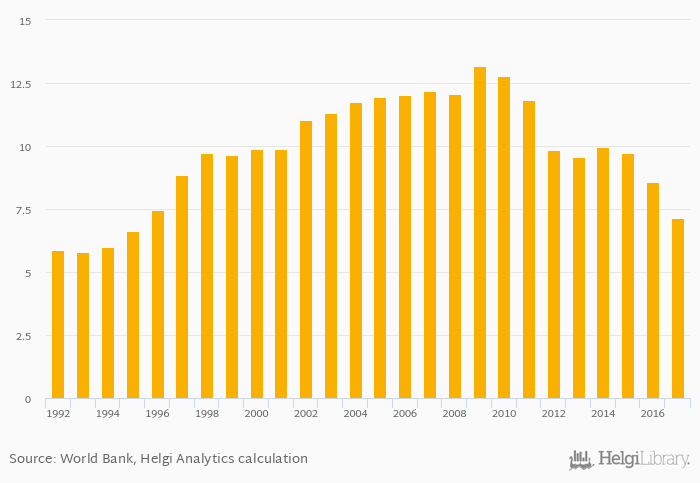
Fixed lines per household fell 16.6% to 7.16% in Zimbabwe in 2017, according to World Bank.
Historically, fixed lines per household in Zimbabwe reached an all time high of 13.2% in 2009 and an all time low of 5.79% in 1993.
Zimbabwe has been ranked 94th within the group of 103 countries we follow in terms of fixed lines per household, 8 places above the position seen 10 years ago.
| Fixed Lines Per Household | Unit | 1997 | 1998 | 1999 | 2000 | 2001 | 2002 | 2003 | 2004 | 2005 | 2006 | 2007 | 2008 | 2009 | 2010 | 2011 | 2012 | 2013 | 2014 | 2015 | 2016 | 2017 |
| Angola | % | ... | ... | ... | ... | ... | ... | ... | ... | ... | ... | ... | ... | ... | ... | ... | ... | ... | ... | ... | ... | ... |
| Botswana | % | 27.1% | 28.7% | 30.6% | 29.3% | 27.3% | ||||||||||||||||
| Dem. Republic of the Congo | % | ... | ... | ... | ... | ... | ... | ... | ... | ... | ... | ... | ... | ... | ... | ... | ... | ... | ... | ... | ... | ... |
| Lesotho | % | ... | ... | ... | ... | ... | ... | ... | ... | ... | ... | ... | ... | ... | ... | ... | ... | ... | ... | ... | ... | |
| Malawi | % | ... | ... | ... | ... | ... | ... | ... | ... | ... | ... | ... | ... | ... | ... | ... | ... | ... | ... | ... | ... | |
| Mozambique | % | ... | ... | ... | ... | ... | ... | ... | ... | ... | ... | ... | ... | ... | ... | ... | ... | ... | ... | ... | ... | ... |
| Namibia | % | ... | ... | ... | ... | ... | ... | ... | ... | ... | ... | ... | ... | ... | ... | ... | ... | ... | ... | ... | ... | ... |
| South Africa | % | 33.5% | 33.0% | 26.0% | 24.2% | 27.0% | ||||||||||||||||
| Swaziland | % | 32.6% | 19.2% | 19.0% | 17.9% | 17.0% | ... | |||||||||||||||
| Tanzania | % | ... | ... | ... | ... | ... | ... | ... | ... | ... | ... | ... | ... | ... | ... | ... | ... | ... | ... | ... | ... | ... |
| Zambia | % | 3.12% | 2.89% | 3.91% | 3.72% | 3.65% | ||||||||||||||||
| Zimbabwe | % | 11.8% | 9.86% | 9.55% | 9.95% | 9.71% |
 Helgi Library


