
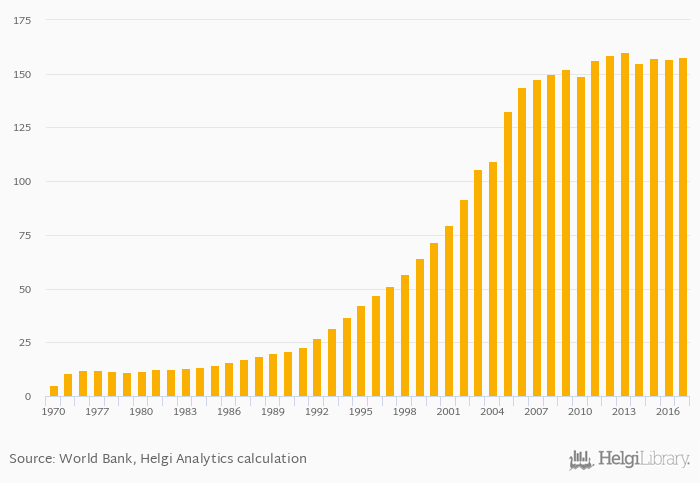
Fixed lines per household rose 0.436% to 158% in Iran in 2017, according to World Bank.
Historically, fixed lines per household in Iran reached an all time high of 160% in 2013 and an all time low of 5.00% in 1970.
Iran has been ranked 4th within the group of 103 countries we follow in terms of fixed lines per household, 7 places above the position seen 10 years ago.
| Fixed Lines Per Household | Unit | 1997 | 1998 | 1999 | 2000 | 2001 | 2002 | 2003 | 2004 | 2005 | 2006 | 2007 | 2008 | 2009 | 2010 | 2011 | 2012 | 2013 | 2014 | 2015 | 2016 | 2017 |
| Afghanistan | % | ... | ... | ... | ... | ... | ... | ... | ... | ... | ... | ... | ... | ... | ... | ... | ... | ... | ... | ... | ... | ... |
| China | % | 64.1% | 61.7% | 58.4% | 53.9% | 49.2% | ||||||||||||||||
| India | % | 13.3% | 12.4% | 11.4% | 10.5% | 9.74% | ||||||||||||||||
| Iran | % | 156% | 159% | 160% | 155% | 157% | ||||||||||||||||
| Iraq | % | ... | ... | ... | ... | ... | ... | ... | ... | ... | ... | ... | ... | ... | ... | ... | ... | ... | ... | ... | ... | ... |
| Kazakhstan | % | 95.7% | 97.2% | 97.2% | 95.6% | 90.5% | ||||||||||||||||
| Kuwait | % | ... | ... | ... | ... | ... | ... | ... | ... | ... | ... | ... | ... | ... | ... | ... | ... | ... | ... | ... | ... | ... |
| Pakistan | % | 18.7% | 18.6% | 19.7% | 14.8% | 10.4% | ||||||||||||||||
| Saudi Arabia | % | ... | ... | ... | ... | ... | ... | ... | ... | ... | ... | ... | ... | ... | ... | ... | ... | ... | ... | ... | ... | ... |
| Syria | % | ... | ... | ... | ... | ... | ... | ... | ... | ... | ... | ... | ... | ... | ... | ... | ... | ... | ... | ... | ... | ... |
| Turkmenistan | % | 69.9% | 72.6% | 75.2% | 77.1% | 79.1% | ... | |||||||||||||||
| Uzbekistan | % | 32.7% | 33.0% | 32.7% | 40.2% | 44.3% |
 Helgi Library


