
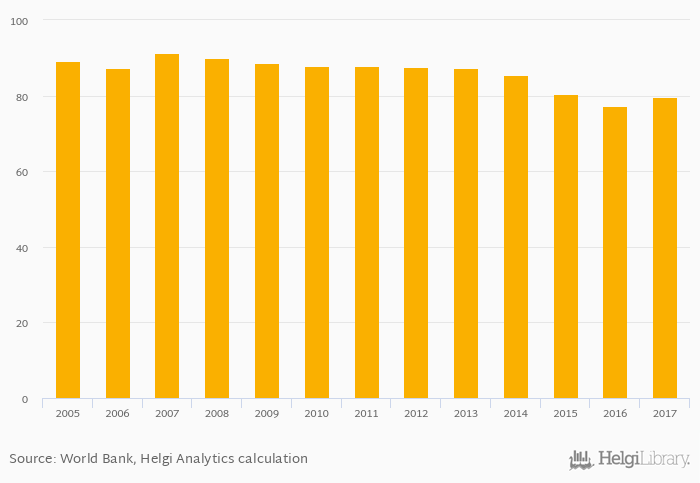
Fixed lines per household rose 3.12% to 79.6% in Montenegro in 2017, according to World Bank.
Historically, fixed lines per household in Montenegro reached an all time high of 91.4% in 2007 and an all time low of 77.2% in 2016. When compared to Montenegro's main peers, fixed lines per household in Albania amounted to 32.4%, 68.6% in Bosnia and Herzegovina, 85.6% in Croatia and 103% in Serbia in 2017.
Montenegro has been ranked 37th within the group of 103 countries we follow in terms of fixed lines per household, 8 places above the position seen 10 years ago.
| Fixed Lines Per Household | Unit | 1997 | 1998 | 1999 | 2000 | 2001 | 2002 | 2003 | 2004 | 2005 | 2006 | 2007 | 2008 | 2009 | 2010 | 2011 | 2012 | 2013 | 2014 | 2015 | 2016 | 2017 |
| Albania | % | 45.8% | 41.9% | 37.6% | 31.4% | 30.0% | ||||||||||||||||
| Bosnia and Herzegovina | % | 88.9% | 82.0% | 78.0% | 77.7% | 70.5% | ||||||||||||||||
| Croatia | % | 113% | 107% | 102% | 95.9% | 90.2% | ||||||||||||||||
| Greece | % | 131% | 124% | 122% | 120% | 118% | ||||||||||||||||
| Hungary | % | 72.1% | 72.4% | 72.4% | 72.8% | 74.5% | ||||||||||||||||
| Italy | % | 90.2% | 88.1% | 84.8% | 82.1% | 80.0% | ||||||||||||||||
| Kosovo | % | ... | ... | ... | ... | ... | ... | ... | ... | ... | ... | ... | ... | ... | ... | ... | ... | ... | ... | ... | ... | ... |
| Macedonia | % | 71.1% | 68.4% | 66.0% | 63.5% | 61.1% | ||||||||||||||||
| Montenegro | % | ... | ... | ... | ... | ... | ... | ... | ... | 87.7% | 87.4% | 87.3% | 85.3% | 80.3% | ||||||||
| Romania | % | 66.0% | 65.5% | 66.5% | 64.1% | 60.0% | ||||||||||||||||
| Serbia | % | ... | ... | ... | ... | ... | ... | ... | 121% | 119% | 121% | 113% | 110% | |||||||||
| Slovenia | % | 108% | 101% | 95.9% | 91.5% | 88.7% |
 Helgi Library


