
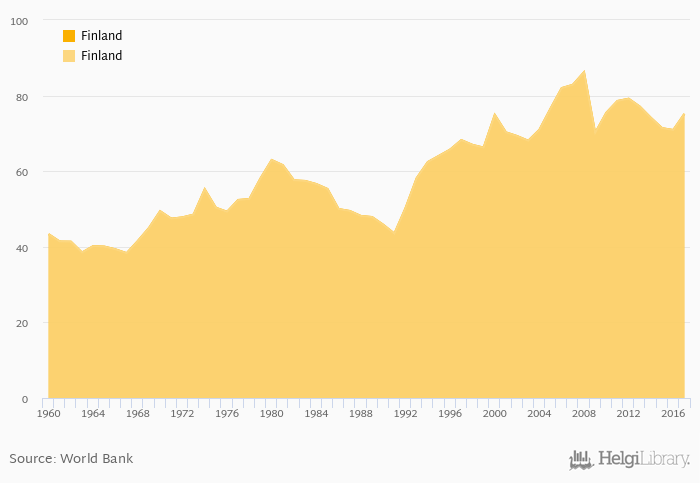
Foreign trade as a share of GDP rose 5.45% to 76.7% in Finland in 2017, according to the National Statistical Office.
Historically, foreign trade as a share of GDP in Finland reached an all time high of 86.5% in 2008 and an all time low of 38.3% in 1967.
Finland has been ranked 80th within the group of 163 countries we follow in terms of foreign trade as a share of GDP, 4 places above the position seen 10 years ago.
| Foreign Trade (As % of GDP) | Unit | 2001 | 2002 | 2003 | 2004 | 2005 | 2006 | 2007 | 2008 | 2009 | 2010 | 2011 | 2012 | 2013 | 2014 | 2015 | 2016 | 2017 | 2018 | 2019 | 2020 | 2021 |
| Australia | % | 41.6% | 40.8% | 42.0% | 43.4% | 45.8% | ||||||||||||||||
| Finland | % | 71.4% | 70.9% | 75.1% | 78.2% | 79.6% | ||||||||||||||||
| Indonesia | % | 41.9% | 37.4% | 39.4% | 43.1% | 37.6% | ||||||||||||||||
| Malaysia | % | 131% | 127% | 133% | 130% | 123% | ||||||||||||||||
| New Zealand | % | 54.9% | 52.5% | 54.2% | 55.8% | 54.3% | ||||||||||||||||
| Papua New Guinea | % | ... | ... | ... | ... | ... | ... | ... | ... | ... | ... | ... | ... | ... | ... | ... | ... | ... | ||||
| Philippines | % | 59.1% | 61.8% | 68.2% | 72.2% | 68.8% | ||||||||||||||||
| Singapore | % | 329% | 303% | 316% | 324% | 322% |
 Helgi Library


