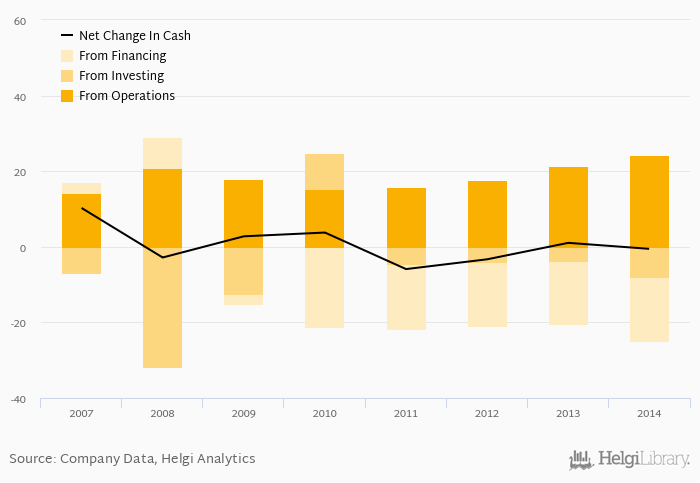
Fortuna Entertainment Group's operating cash flow stood at EUR 24.2 mil in 2014, up 13.6% when compared to the previous year. Historically, between 2007 - 2014, the firm’s operating cash flow reached a high of EUR 24.2 mil in 2014 and a low of EUR 14.2 mil in 2007.
Fortuna Entertainment Group's total investments stood at EUR -8.04 mil and accounted for 2.84% of sales in 2014. This is compared to an average of 4.07% as seen over the last five years.
Cash from financing amounted to EUR -16.8 mil, so the company generated EUR -0.545 mil net cash in 2014.
At the end of 2014, the company had a net debt of EUR 24.7 mil, or 0.870x of EBITDA and 0.821 of equity. Net working capital amounted to EUR -13.8 mil, or -12.5% of sales. The cash conversion cycle stood at -446 days in 2014. This is an improvement compared to the previous year (-526 days), so Fortuna Entertainment Group’s working capital was tied up for 79.5 fewer days.
You can see all the company’s data at Fortuna Entertainment Group profile, or you can download a report on the company in the report section.
 Helgi Library