
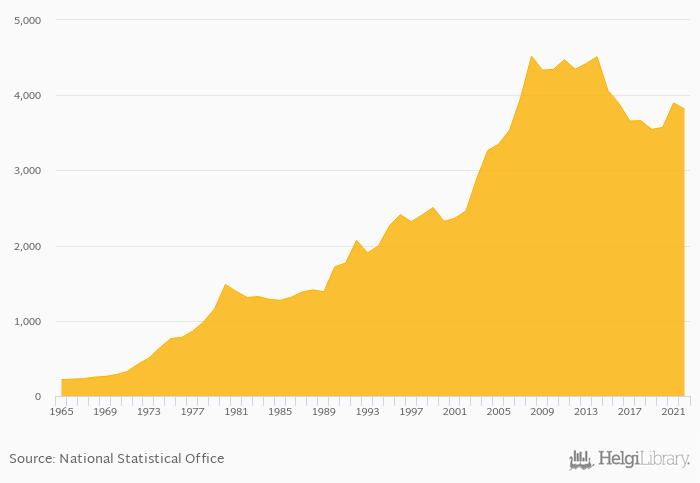
GDP per capita in USD terms fell 2.09% to USD 3,816 in Tunisia in 2022, according to the National Statistical Office.
Historically, GDP per capita in USD terms in Tunisia reached an all time high of USD 4,520 in 2008 and an all time low of USD 218 in 1965. When compared to Tunisia's main peers, GDP per capita in USD terms in Algeria amounted to USD 4,151 , USD 33,740 in Italy, USD 6,026 in Libya and USD 32,912 in Malta in 2022.
Tunisia has been ranked 110th within the group of 172 countries we follow in terms of GDP per capita in USD terms, 5 places below the position seen 10 years ago.
| GDP Per Capita (Current USD) | Unit | 2007 | 2008 | 2009 | 2010 | 2011 | 2012 | 2013 | 2014 | 2015 | 2016 | 2017 | 2018 | 2019 | 2020 | 2021 | 2022 | 2023 | 2024 | 2025 | 2026 | 2027 |
| Algeria | USD | 3,660 | 4,151 | 4,162 | 4,242 | 4,372 | ||||||||||||||||
| Austria | USD | 53,332 | 52,062 | 52,316 | 54,409 | 56,625 | ||||||||||||||||
| Chad | USD | 697 | 743 | 755 | 772 | 792 | ||||||||||||||||
| Egypt | USD | 4,144 | 4,504 | 4,437 | 4,715 | 5,050 | ||||||||||||||||
| France | USD | 45,188 | 42,330 | 42,646 | 44,431 | 46,193 | ||||||||||||||||
| Greece | USD | 20,263 | 20,876 | 21,372 | 22,307 | 23,304 | ||||||||||||||||
| Italy | USD | 35,473 | 33,740 | 33,662 | 34,836 | 36,093 | ||||||||||||||||
| Libya | USD | 5,813 | 6,026 | 6,392 | 6,599 | 6,836 | ||||||||||||||||
| Malta | USD | 33,667 | 32,912 | 33,793 | 35,420 | 37,378 | ||||||||||||||||
| Morocco | USD | 3,934 | 3,896 | 4,068 | 4,247 | 4,439 | ||||||||||||||||
| Slovenia | USD | 29,298 | 29,469 | 30,840 | 33,108 | 35,333 | ||||||||||||||||
| Spain | USD | 30,090 | 29,198 | 29,729 | 31,447 | 33,081 | ||||||||||||||||
| Switzerland | USD | 92,249 | 92,434 | 94,835 | 99,072 | 102,376 | ||||||||||||||||
| Tunisia | USD | 3,897 | 3,816 | 3,762 | 3,899 | 4,070 | ||||||||||||||||
| Turkey | USD | 9,654 | 9,961 | 10,863 | 11,841 | 12,798 |
 Helgi Library


