
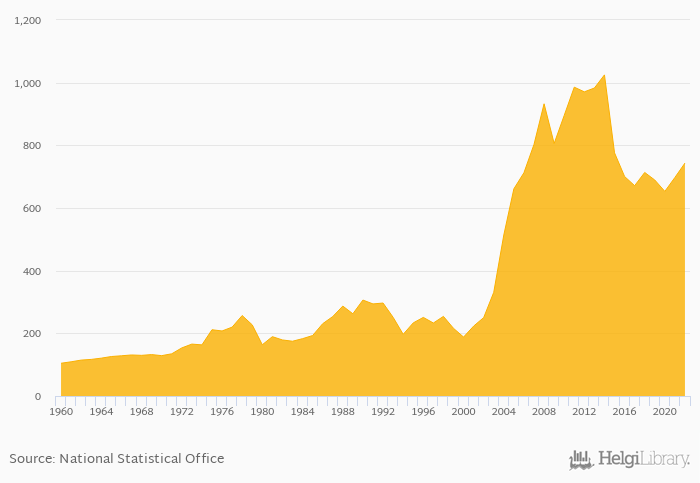
GDP per capita in USD terms rose 6.60% to USD 743 in Chad in 2022, according to the National Statistical Office.
Historically, GDP per capita in USD terms in Chad reached an all time high of USD 1,025 in 2014 and an all time low of USD 104 in 1960. When compared to Chad's main peers, GDP per capita in USD terms in Cameroon amounted to USD 1,584 , USD 561 in Niger, USD 2,326 in Nigeria and USD 916 in Sudan in 2022.
Chad has been ranked 158th within the group of 172 countries we follow in terms of GDP per capita in USD terms, 5 places below the position seen 10 years ago.
| GDP Per Capita (Current USD) | Unit | 2007 | 2008 | 2009 | 2010 | 2011 | 2012 | 2013 | 2014 | 2015 | 2016 | 2017 | 2018 | 2019 | 2020 | 2021 | 2022 | 2023 | 2024 | 2025 | 2026 | 2027 |
| Algeria | USD | 3,660 | 4,151 | 4,162 | 4,242 | 4,372 | ||||||||||||||||
| Benin | USD | 1,417 | 1,367 | 1,383 | 1,447 | 1,538 | ||||||||||||||||
| Cameroon | USD | 1,667 | 1,584 | 1,609 | 1,695 | 1,784 | ||||||||||||||||
| Central African Republic | USD | 525 | 496 | 515 | 541 | 567 | ||||||||||||||||
| Chad | USD | 697 | 743 | 755 | 772 | 792 | ||||||||||||||||
| Egypt | USD | 4,144 | 4,504 | 4,437 | 4,715 | 5,050 | ||||||||||||||||
| Ethiopia | USD | 996 | 1,098 | 1,226 | 1,339 | 1,476 | ||||||||||||||||
| Gabon | USD | 9,483 | 10,282 | 9,850 | 10,024 | 10,302 | ||||||||||||||||
| Libya | USD | 5,813 | 6,026 | 6,392 | 6,599 | 6,836 | ||||||||||||||||
| Mali | USD | 918 | 858 | 876 | 921 | 954 | ||||||||||||||||
| Niger | USD | 595 | 561 | 574 | 636 | 681 | ||||||||||||||||
| Nigeria | USD | 2,089 | 2,326 | 2,585 | 2,860 | 3,163 | ||||||||||||||||
| South Sudan | USD | ... | 364 | 328 | 569 | 704 | 748 | |||||||||||||||
| Sudan | USD | 772 | 916 | 929 | 974 | 1,034 |
 Helgi Library


