
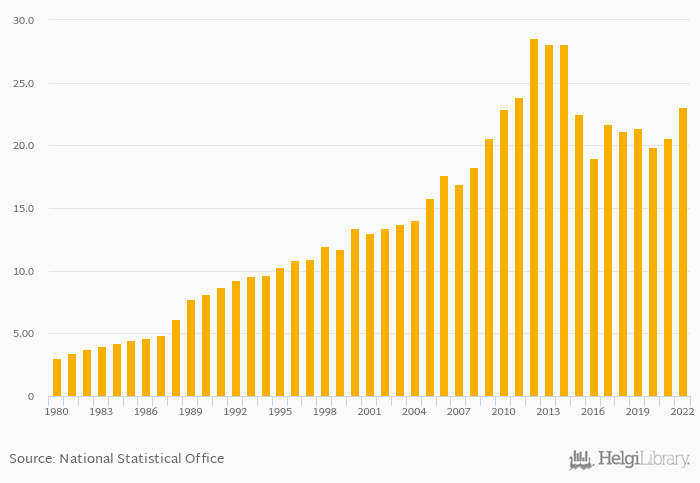
GDP in USD PPP terms rose 11.7% to USD 23.0 bil in Congo in 2022, according to the National Statistical Office.
Historically, GDP in USD PPP terms in Congo reached an all time high of USD 28.6 bil in 2012 and an all time low of USD 3.06 bil in 1980. When compared to Congo's main peers, GDP in USD PPP terms in Cameroon amounted to USD 123 bil, USD 5.46 bil in Central African Republic, USD 39.1 bil in Gabon and USD 129 bil in Dem. Republic of the Congo in 2022.
Congo has been ranked 150th within the group of 173 countries we follow in terms of GDP in USD PPP terms, 28 places below the position seen 10 years ago.
| GDP PPP (Current USD) | Unit | 2007 | 2008 | 2009 | 2010 | 2011 | 2012 | 2013 | 2014 | 2015 | 2016 | 2017 | 2018 | 2019 | 2020 | 2021 | 2022 | 2023 | 2024 | 2025 | 2026 | 2027 |
| Angola | USD bil | 223 | 245 | 263 | 279 | 295 | ||||||||||||||||
| Cameroon | USD bil | 111 | 123 | 134 | 143 | 153 | ||||||||||||||||
| Central African Republic | USD bil | 5.02 | 5.46 | 5.82 | 6.17 | 6.52 | ||||||||||||||||
| Chad | USD bil | 27.0 | 29.9 | 32.1 | 33.9 | 35.7 | ||||||||||||||||
| Congo | USD bil | 20.6 | 23.0 | 24.9 | 27.3 | 28.3 | ||||||||||||||||
| Dem. Republic of the Congo | USD bil | 113 | 129 | 142 | 155 | 169 | ||||||||||||||||
| Equatorial Guinea | USD bil | 25.7 | 29.1 | 29.2 | 26.2 | 26.0 | ||||||||||||||||
| Gabon | USD bil | 35.5 | 39.1 | 42.0 | 44.5 | 47.0 | ||||||||||||||||
| Nigeria | USD bil | 1,154 | 1,275 | 1,360 | 1,430 | 1,498 | ||||||||||||||||
| Sudan | USD bil | 195 | 208 | 221 | 238 | 259 | ||||||||||||||||
| Zambia | USD bil | 69.2 | 76.3 | 82.2 | 87.5 | 93.2 |
 Helgi Library


