
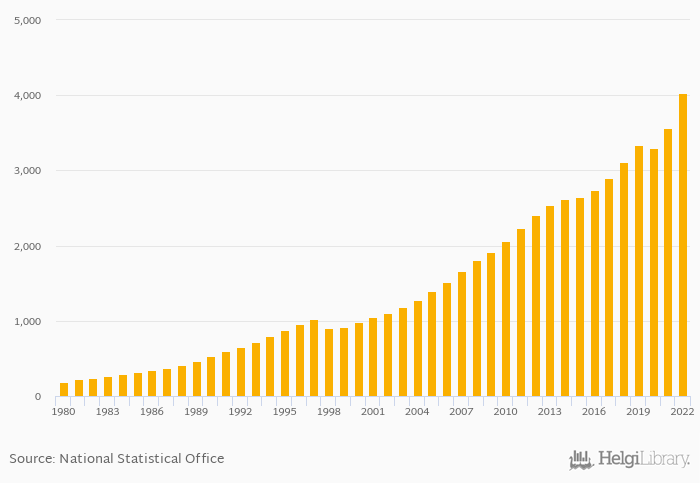
GDP in USD PPP terms rose 12.8% to USD 4,024 bil in Indonesia in 2022, according to the National Statistical Office.
Historically, GDP in USD PPP terms in Indonesia reached an all time high of USD 4,024 bil in 2022 and an all time low of USD 190 bil in 1980. When compared to Indonesia's main peers, GDP in USD PPP terms in Australia amounted to USD 1,615 bil, USD 1,097 bil in Malaysia, USD 1,155 bil in Philippines and USD 701 bil in Singapore in 2022.
Indonesia has been ranked 8th within the group of 173 countries we follow in terms of GDP in USD PPP terms, 2 places above the position seen 10 years ago.
| GDP PPP (Current USD) | Unit | 2007 | 2008 | 2009 | 2010 | 2011 | 2012 | 2013 | 2014 | 2015 | 2016 | 2017 | 2018 | 2019 | 2020 | 2021 | 2022 | 2023 | 2024 | 2025 | 2026 | 2027 |
| Australia | USD bil | 1,454 | 1,615 | 1,704 | 1,772 | 1,841 | ||||||||||||||||
| Cambodia | USD bil | 79.3 | 89.3 | 98.2 | 107 | 116 | ||||||||||||||||
| China | USD bil | 27,206 | 30,074 | 32,529 | 34,706 | 36,988 | ||||||||||||||||
| Indonesia | USD bil | 3,566 | 4,024 | 4,374 | 4,706 | 5,049 | ||||||||||||||||
| Malaysia | USD bil | 971 | 1,097 | 1,185 | 1,270 | 1,350 | ||||||||||||||||
| New Zealand | USD bil | 238 | 261 | 275 | 287 | 299 | ||||||||||||||||
| Papua New Guinea | USD bil | 35.1 | 39.1 | 42.5 | 44.7 | 46.9 | ||||||||||||||||
| Philippines | USD bil | 1,013 | 1,155 | 1,256 | 1,360 | 1,468 | ||||||||||||||||
| Singapore | USD bil | 635 | 701 | 742 | 778 | 812 | ||||||||||||||||
| Taiwan | USD bil | 1,466 | 1,622 | 1,727 | 1,801 | 1,871 | ||||||||||||||||
| Thailand | USD bil | 1,343 | 1,480 | 1,589 | 1,680 | 1,768 | ||||||||||||||||
| Vietnam | USD bil | 1,134 | 1,300 | 1,429 | 1,555 | 1,690 |
 Helgi Library


