
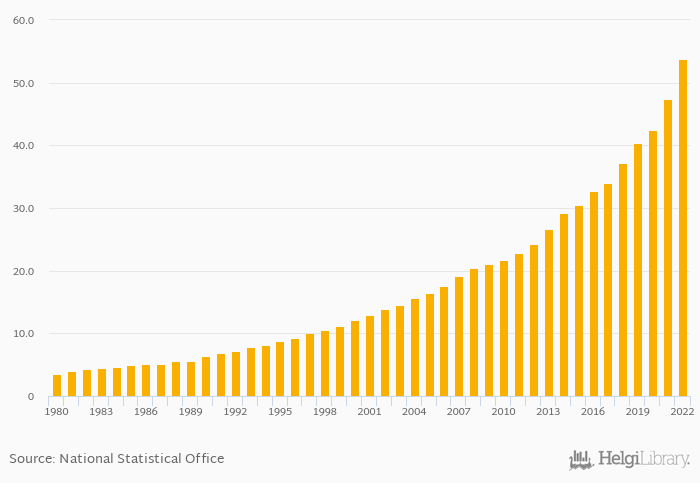
GDP in USD PPP terms rose 13.2% to USD 53.7 bil in Benin in 2022, according to the National Statistical Office.
Historically, GDP in USD PPP terms in Benin reached an all time high of USD 53.7 bil in 2022 and an all time low of USD 3.58 bil in 1980. When compared to Benin's main peers, GDP in USD PPP terms in Burkina Faso amounted to USD 58.8 bil, USD 37.6 bil in Niger, USD 1,275 bil in Nigeria and USD 22.8 bil in Togo in 2022.
Benin has been ranked 116th within the group of 173 countries we follow in terms of GDP in USD PPP terms, 17 places above the position seen 10 years ago.
| GDP PPP (Current USD) | Unit | 2007 | 2008 | 2009 | 2010 | 2011 | 2012 | 2013 | 2014 | 2015 | 2016 | 2017 | 2018 | 2019 | 2020 | 2021 | 2022 | 2023 | 2024 | 2025 | 2026 | 2027 |
| Algeria | USD bil | 536 | 601 | 638 | 664 | 689 | ||||||||||||||||
| Benin | USD bil | 47.4 | 53.7 | 59.1 | 63.9 | 69.0 | ||||||||||||||||
| Burkina Faso | USD bil | 53.0 | 58.8 | 63.9 | 68.6 | 73.5 | ||||||||||||||||
| Cameroon | USD bil | 111 | 123 | 134 | 143 | 153 | ||||||||||||||||
| Chad | USD bil | 27.0 | 29.9 | 32.1 | 33.9 | 35.7 | ||||||||||||||||
| Ghana | USD bil | 196 | 218 | 232 | 246 | 264 | ||||||||||||||||
| Ivory Coast | USD bil | 161 | 182 | 200 | 218 | 236 | ||||||||||||||||
| Libya | USD bil | 147 | 128 | 157 | 173 | 189 | ||||||||||||||||
| Mali | USD bil | 51.0 | 56.1 | 61.1 | 65.7 | 70.3 | ||||||||||||||||
| Niger | USD bil | 32.9 | 37.6 | 41.8 | 48.1 | 53.0 | ||||||||||||||||
| Nigeria | USD bil | 1,154 | 1,275 | 1,360 | 1,430 | 1,498 | ||||||||||||||||
| Togo | USD bil | 20.2 | 22.8 | 25.1 | 27.2 | 29.6 |
 Helgi Library


