
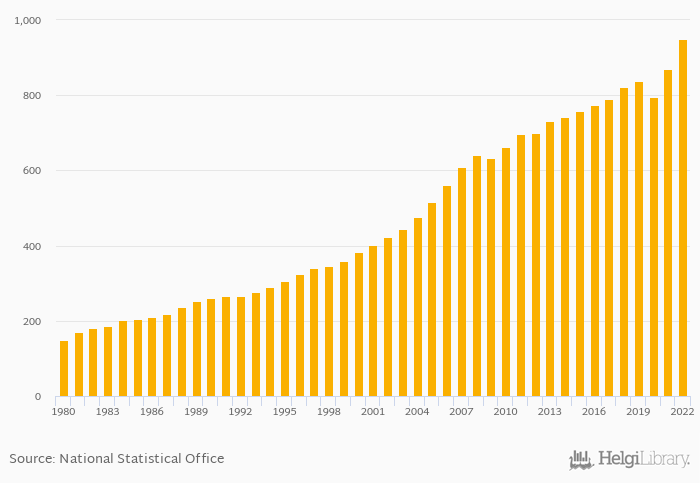
GDP in USD PPP terms rose 9.36% to USD 950 bil in South Africa in 2022, according to the National Statistical Office.
Historically, GDP in USD PPP terms in South Africa reached an all time high of USD 950 bil in 2022 and an all time low of USD 149 bil in 1980. When compared to South Africa's main peers, GDP in USD PPP terms in Botswana amounted to USD 47.0 bil, USD 6.40 bil in Lesotho, USD 28.0 bil in Namibia and USD 12.7 bil in Swaziland in 2022.
South Africa has been ranked 34th within the group of 173 countries we follow in terms of GDP in USD PPP terms, 6 places below the position seen 10 years ago.
| GDP PPP (Current USD) | Unit | 2007 | 2008 | 2009 | 2010 | 2011 | 2012 | 2013 | 2014 | 2015 | 2016 | 2017 | 2018 | 2019 | 2020 | 2021 | 2022 | 2023 | 2024 | 2025 | 2026 | 2027 |
| Angola | USD bil | 223 | 245 | 263 | 279 | 295 | ||||||||||||||||
| Botswana | USD bil | 42.2 | 47.0 | 50.7 | 53.8 | 57.0 | ||||||||||||||||
| Lesotho | USD bil | 5.85 | 6.40 | 6.73 | 7.02 | 7.32 | ||||||||||||||||
| Mozambique | USD bil | 43.2 | 48.0 | 52.2 | 57.7 | 61.8 | ||||||||||||||||
| Namibia | USD bil | 25.4 | 28.0 | 30.0 | 31.4 | 32.8 | ||||||||||||||||
| South Africa | USD bil | 869 | 950 | 995 | 1,028 | 1,062 | ||||||||||||||||
| Swaziland | USD bil | 11.6 | 12.7 | 13.4 | 14.0 | 14.6 | ||||||||||||||||
| Zambia | USD bil | 69.2 | 76.3 | 82.2 | 87.5 | 93.2 | ||||||||||||||||
| Zimbabwe | USD bil | 36.6 | 40.4 | 43.0 | 45.2 | 47.4 |
 Helgi Library


