
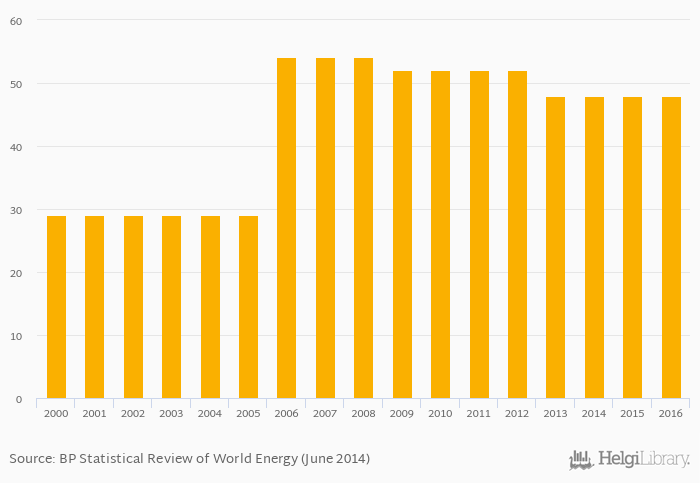
Geothermal capacity in terms of cumulative installed power capacity rose 0% to 48.0 MW in Guatemala in 2016, according to World Bank / EIA.
Historically, geothermal capacity in terms of cumulative installed power capacity in Guatemala reached an all time high of 54.2 MW in 2008 and an all time low of 29.0 MW in 2000.
Guatemala has been ranked 16th within the group of 27 countries we follow in terms of geothermal capacity in terms of cumulative installed power capacity, 2 places below the position seen 10 years ago.
| Geothermal Capacity (Cumulative Installed Power Capacity) | Unit | 1999 | 2000 | 2001 | 2002 | 2003 | 2004 | 2005 | 2006 | 2007 | 2008 | 2009 | 2010 | 2011 | 2012 | 2013 | 2014 | 2015 | 2016 | 2017 | 2018 | 2019 |
| Belize | MW | ... | ... | ... | ... | ... | ... | ... | ... | ... | ... | ... | ... | ... | ... | ... | ... | ... | ... | ... | ... | ... |
| Costa Rica | MW | ... | 218 | 218 | 217 | 207 | 207 | |||||||||||||||
| El Salvador | MW | ... | 204 | 204 | 204 | 204 | 204 | |||||||||||||||
| Guatemala | MW | ... | 49.0 | 49.0 | 49.0 | 49.0 | 49.0 | |||||||||||||||
| Honduras | MW | ... | ... | ... | ... | ... | 35.0 | |||||||||||||||
| Mexico | MW | ... | 823 | 813 | 906 | 926 | 985 | |||||||||||||||
| Nicaragua | MW | ... | 155 | 155 | 155 | 155 | 155 | |||||||||||||||
| USA | MW | ... | 2,607 | 2,514 | 2,542 | 2,517 | 2,483 |
 Helgi Library


