
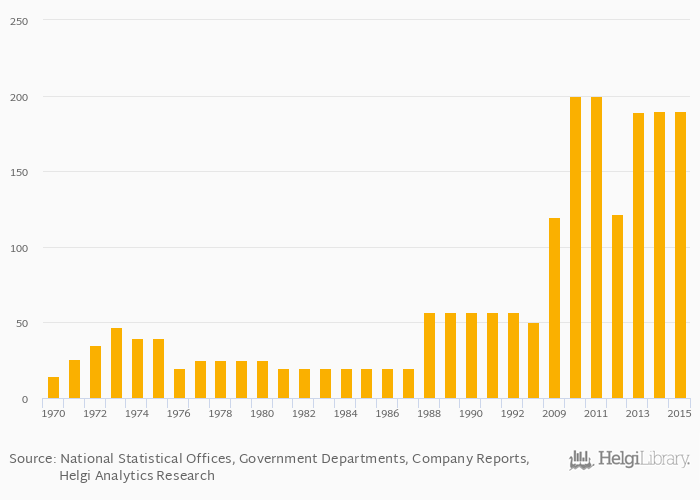
Gypsum and plaster production rose 0% to 190 kt in Angola in 2015, according to the National Statistical Office.
Historically, gypsum and plaster production in Angola reached an all time high of 200 kt in 2011 and an all time low of 14.8 kt in 1970.
Angola has been ranked 48th within the group of 84 countries we follow in terms of gypsum and plaster production, 48 places below the position seen 10 years ago.
| Gypsum and Plaster Production | Unit | 1995 | 1996 | 1997 | 1998 | 1999 | 2000 | 2001 | 2002 | 2003 | 2004 | 2005 | 2006 | 2007 | 2008 | 2009 | 2010 | 2011 | 2012 | 2013 | 2014 | 2015 |
| Angola | kt | ... | ... | ... | ... | ... | ... | ... | ... | ... | ... | ... | ... | ... | ... | 120 | 200 | 200 | 122 | 189 | ||
| Botswana | kt | ... | ... | ... | ... | ... | ... | ... | ... | ... | ... | ... | ... | ... | ... | ... | ... | ... | ... | ... | ... | ... |
| Central African Republic | kt | ... | ... | ... | ... | ... | ... | ... | ... | ... | ... | ... | ... | ... | ... | ... | ... | ... | ... | ... | ... | ... |
| Congo | kt | ... | ... | ... | ... | ... | ... | ... | ... | ... | ... | ... | ... | ... | ... | ... | ... | ... | ... | ... | ... | ... |
| Dem. Republic of the Congo | kt | ... | ... | ... | ... | ... | ... | ... | ... | ... | ... | ... | ... | ... | ... | ... | ... | ... | ... | ... | ... | ... |
| Namibia | kt | ... | ... | ... | ... | ... | ... | ... | ... | ... | ... | ... | ... | ... | ... | ... | ... | ... | ... | ... | ... | ... |
| South Africa | kt | 598 | 1,027 | 476 | 558 | 559 | ||||||||||||||||
| Tanzania | kt | 8.11 | 26.9 | 38.7 | 91.6 | 172 | ||||||||||||||||
| Zambia | kt | ... | ... | ... | ... | ... | ... | ... | ... | ... | ... | ... | ... | ... | ... | ... | ... | ... | ... | ... | ... | ... |
| Zimbabwe | kt | ... | ... | ... | ... | ... | ... | ... | ... | ... | ... | ... | ... | ... | ... | ... | ... | ... | ... | ... | ... | ... |
 Helgi Library


