
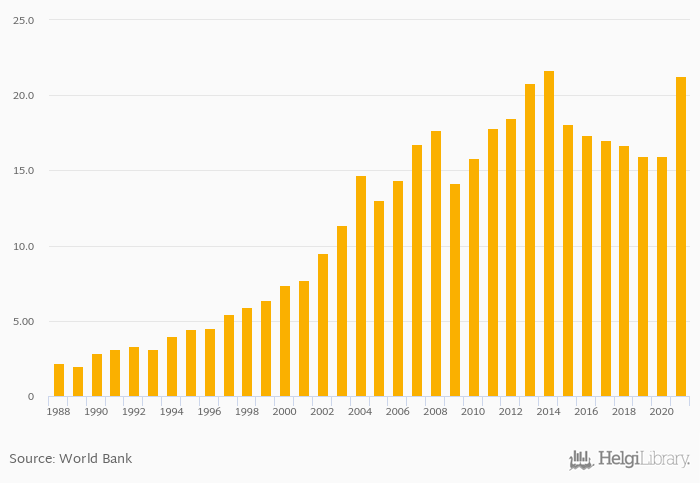
Hi-tech exports rose 33.1% to USD 21.3 bil in Austria in 2021, according to World Bank.
Historically, hi-tech exports in Austria reached an all time high of USD 21.6 bil in 2014 and an all time low of USD 1.99 bil in 1989. When compared to Austria's main peers, hi-tech exports in Germany amounted to USD 210 bil, USD 19.7 bil in Hungary, USD 38.9 bil in Italy and USD 38.2 bil in Switzerland in 2021.
Austria has been ranked 20th within the group of 93 countries we follow in terms of hi-tech exports, 1 place above the position seen 10 years ago.
| Hi-Tech Exports (USD) | Unit | 2001 | 2002 | 2003 | 2004 | 2005 | 2006 | 2007 | 2008 | 2009 | 2010 | 2011 | 2012 | 2013 | 2014 | 2015 | 2016 | 2017 | 2018 | 2019 | 2020 | 2021 |
| Austria | USD bil | 18.1 | 17.3 | 17.0 | 16.7 | 16.0 | ||||||||||||||||
| Belgium | USD bil | 22.6 | 27.2 | 25.2 | 28.2 | 33.1 | ||||||||||||||||
| Czechia | USD bil | 24.8 | 24.7 | 29.4 | 36.0 | 37.7 | ||||||||||||||||
| France | USD bil | 110 | 109 | 109 | 118 | 121 | ||||||||||||||||
| Germany | USD bil | 199 | 205 | 195 | 210 | 208 | ||||||||||||||||
| Hungary | USD bil | 14.7 | 15.9 | 16.9 | 18.0 | 18.4 | ||||||||||||||||
| Italy | USD bil | 30.1 | 31.1 | 31.9 | 32.5 | 32.5 | ||||||||||||||||
| Poland | USD bil | 16.5 | 16.9 | 18.8 | 21.8 | 19.8 | ||||||||||||||||
| Slovakia | USD bil | 7.46 | 7.48 | 8.81 | 8.97 | 8.05 | ||||||||||||||||
| Slovenia | USD bil | 1.55 | 1.67 | 1.75 | 2.09 | 2.33 | ||||||||||||||||
| Switzerland | USD bil | 53.8 | 55.5 | 29.8 | 30.1 | 29.9 |
 Helgi Library


