IMS-Drasnar's operating cash flow stood at CZK 48.4 mil in 2018, up 74.1% when compared to the previous year. Historically, between 2010 - 2018, the firm’s operating cash flow reached a high of CZK 48.4 mil in 2018 and a low of CZK -1.37 mil in 2015.
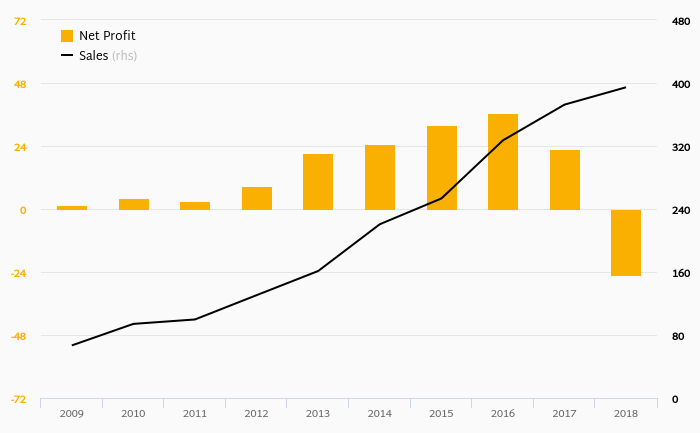
IMS-Drasnar's total investments stood at CZK -26.7 mil and accounted for 6.76% of sales in 2018. This is compared to an average of 10.7% as seen over the last five years.
Cash from financing amounted to CZK -20.9 mil, so the company generated CZK 0.766 mil net cash in 2018.
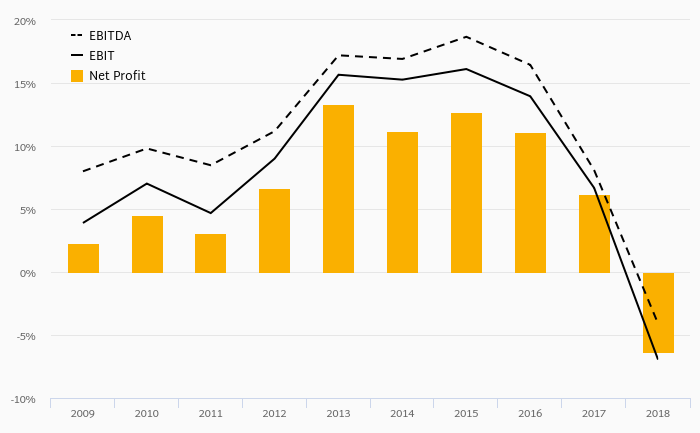
At the end of 2018, the company had a net debt of CZK 100 mil, or -6.20x of EBITDA and 73.5% of equity. Net working capital amounted to CZK 84.8 mil, or 21.5% of sales. Cash conversion cycle is negative and reached 117 days days in 2018. This means IMS-Drasnar generates revenue from customers before it has to pay its suppliers for inventory, among other things.
You can see all the company’s data at IMS-Drasnar profile, or you can download a report on the company in the report section.
 Helgi Library