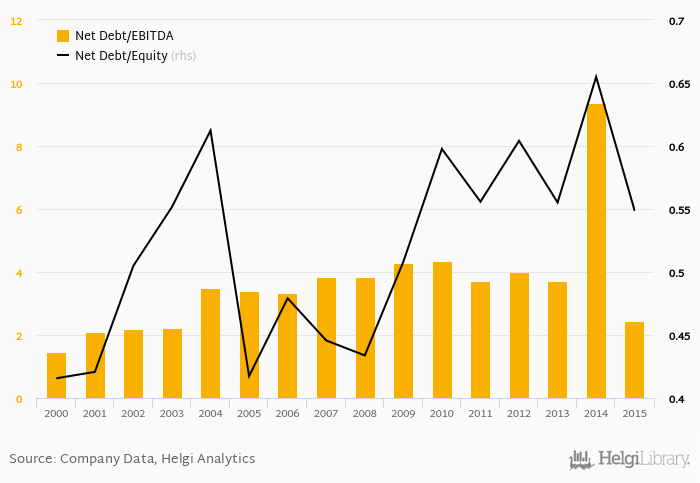
EVN's net debt stood at EUR 1,421 mil and accounted for 0.549 of equity at the end of 2015. The ratio is down 0.106 pp compared to the previous year.
Historically, the firm’s net debt to equity reached a high of 0.655 in 2014 and a low of 0.416 in 2000 between 2000 and 2015. The average for the last five years was 0.584%.
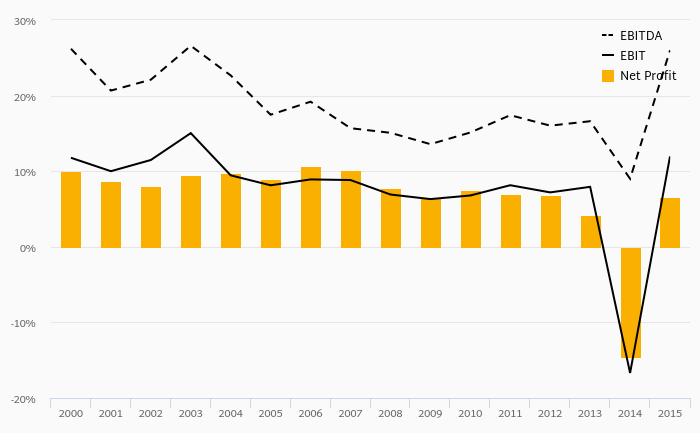
Net debt to EBITDA was calculated at 2.44x at the end of the year. That is up from 4.35x seen in 2010. The ratio reached a high of 9.36x in 2014 and a low of 1.46x in 2000.
The company’s cost of funding amounted to 3.33% in 2015, up which is above the 5-year of 0.568%. Funding costs have “eaten” some 22.5% of the operating profit generated in 2019.
You can see all the company’s data at EVN profile, or you can download a report on the company in the report section.
 Helgi Library