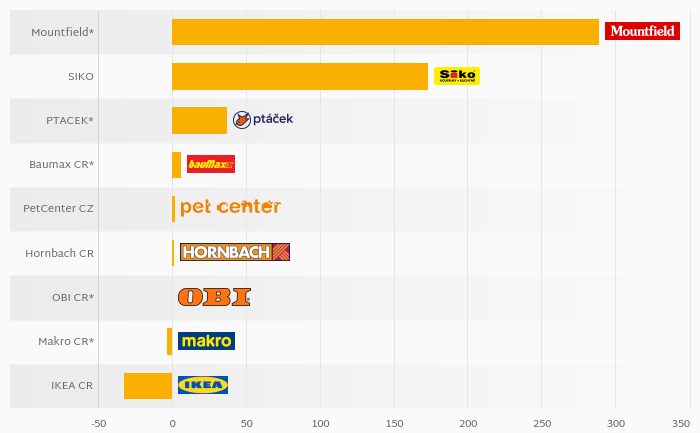
Mountfield's net debt stood at CZK 1,401 mil and accounted for 289% of equity at the end of 2016. The ratio is down 0.983 pp compared to the previous year.
Historically, the firm’s net debt to equity reached a high of 290% in 2015 and a low of 111% in 2010 between 2006 and 2016. The average for the last five years was 273%.
Net debt to EBITDA was calculated at 3.59x at the end of the year. That is up from 3.75x seen in 2011. The ratio reached a high of 9.99x in 2006 and a low of 3.04x in 2009.
The company’s cost of funding amounted to 3.61% in 2016, down which is above the 5-year of 7.39%. Funding costs have “eaten” some 21% of the operating profit generated in 2019.
You can see all the company’s data at Mountfield profile, or you can download a report on the company in the report section.
 Helgi Library