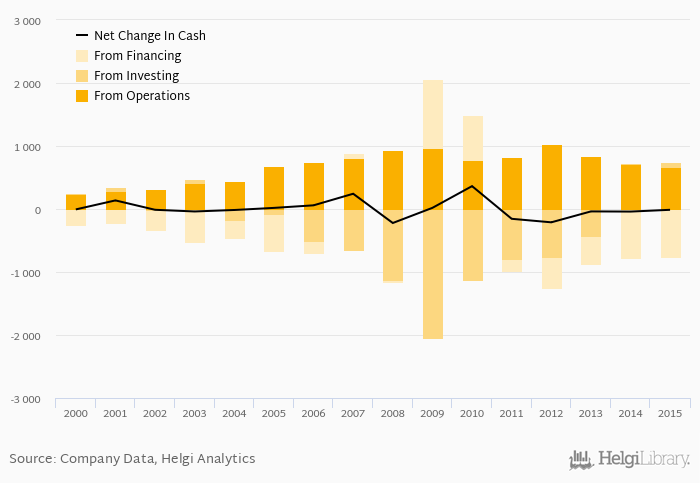
Verbund's operating cash flow stood at EUR 674 mil in 2015, down 6.08% when compared to the previous year. Historically, between 2000 - 2015, the firm’s operating cash flow reached a high of EUR 1,035 mil in 2012 and a low of EUR 241 mil in 2000.
Verbund's total investments stood at EUR 78.7 mil and accounted for 9.70% of sales in 2015. This is compared to an average of 16.5% as seen over the last five years.
Cash from financing amounted to EUR -765 mil, so the company generated EUR -12.8 mil net cash in 2015.
At the end of 2015, the company had a net debt of EUR 3,101 mil, or ... 4.02 x of EBITDA and ... 0.571 of equity. Net working capital amounted to EUR 212 mil, or 7.12% of sales. The cash conversion cycle stood at -20.8 days in 2015. This is a deterioration compared to the previous year (8.92 days), so Verbund’s working capital was tied up for 29.8 more days.
You can see all the company’s data at Verbund profile, or you can download a report on the company in the report section.
 Helgi Library