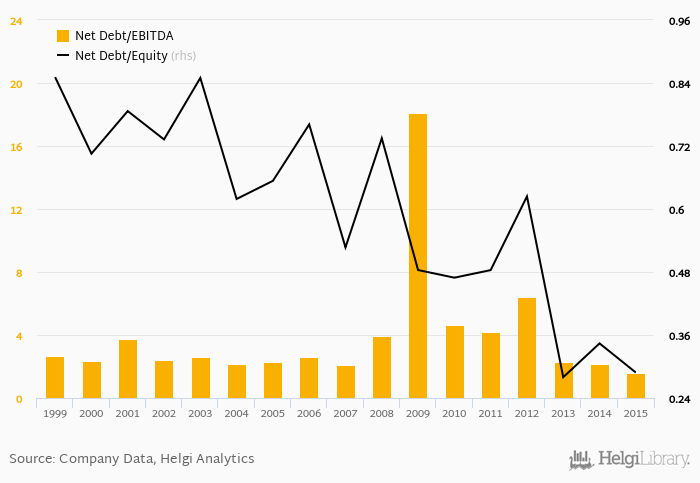
Wienerberger's net debt stood at EUR 593 mil and accounted for 0.288 of equity at the end of 2015. The ratio is down 0.056 pp compared to the previous year.
Historically, the firm’s net debt to equity reached a high of 0.851 in 1999 and a low of 0.280 in 2013 between 1999 and 2015. The average for the last five years was 0.404%.
Net debt to EBITDA was calculated at 1.60x at the end of the year. That is up from 4.66x seen in 2010. The ratio reached a high of 18.1x in 2009 and a low of 1.60x in 2015.
The company’s cost of funding amounted to 6.58% in 2015, up which is above the 5-year of 4.93%. Funding costs have “eaten” some 34.4% of the operating profit generated in 2019.
You can see all the company’s data at Wienerberger profile, or you can download a report on the company in the report section.
 Helgi Library