
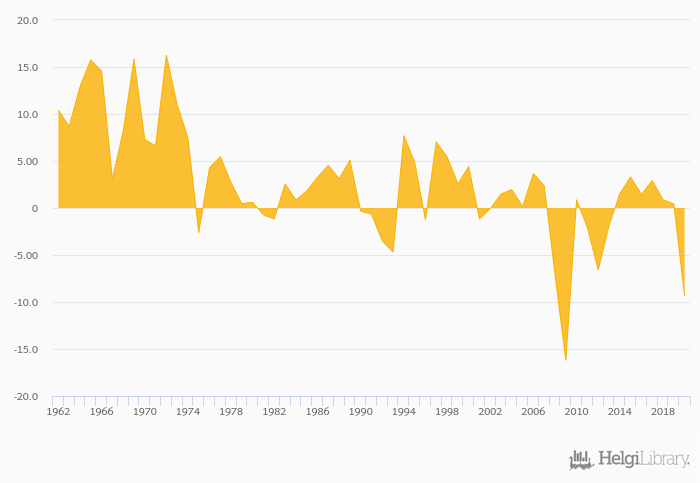
Industrial production growth fell 2.00% to -9.35% in Spain in 2020, according to the National Statistical Office.
Historically, industrial production growth in Spain reached an all time high of 16.3% in 1972 and an all time low of -16.2% in 2009.
Spain has been ranked 39th within the group of 42 countries we follow in terms of industrial production growth, 24 places above the position seen 10 years ago.
| Industrial Production Growth | Unit | 2000 | 2001 | 2002 | 2003 | 2004 | 2005 | 2006 | 2007 | 2008 | 2009 | 2010 | 2011 | 2012 | 2013 | 2014 | 2015 | 2016 | 2017 | 2018 | 2019 | 2020 |
| Algeria | % | 4.35% | 1.40% | 1.53% | 2.26% | ... | ... | ... | ||||||||||||||
| Austria | % | 0.869% | 2.34% | 2.27% | 5.16% | 5.04% | ||||||||||||||||
| Belgium | % | 1.36% | -0.662% | 4.47% | 2.65% | 1.36% | ||||||||||||||||
| France | % | -1.12% | 1.66% | 0.502% | 1.99% | 0.705% | ||||||||||||||||
| Germany | % | 1.35% | 1.45% | 1.32% | 2.71% | 0.961% | ||||||||||||||||
| Ireland | % | 20.9% | 36.9% | 1.79% | -2.24% | -0.134% | ... | ... | ||||||||||||||
| Italy | % | -1.08% | 1.76% | 1.33% | 2.71% | 0.961% | ... | |||||||||||||||
| Mauritania | % | ... | ... | ... | ... | ... | ... | ... | ... | ... | ... | ... | ... | ... | ... | ... | ... | ... | ... | ... | ... | ... |
| Morocco | % | ... | ... | ... | ... | ... | ... | ... | ... | ... | ... | ... | ... | ... | ... | ... | ... | ... | ... | ... | ... | ... |
| Portugal | % | 1.52% | 2.34% | 1.79% | 3.49% | 0.316% | ||||||||||||||||
| Slovenia | % | 2.20% | 5.62% | 6.63% | 7.71% | 5.09% | ||||||||||||||||
| Spain | % | 1.54% | 3.32% | 1.46% | 2.93% | 0.894% | ||||||||||||||||
| Switzerland | % | 1.04% | -1.67% | 0.039% | 5.09% | 5.38% | ||||||||||||||||
| Tunisia | % | -1.08% | -2.44% | -0.547% | -1.08% | -0.518% | ... | ... |
 Helgi Library


