
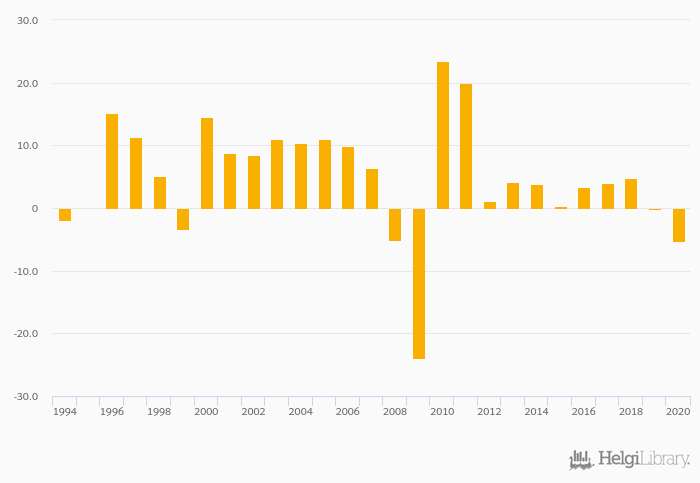
Industrial production growth fell 4.00% to -5.35% in Estonia in 2020, according to the National Statistical Office.
Historically, industrial production growth in Estonia reached an all time high of 23.5% in 2010 and an all time low of -24.0% in 2009.
Estonia has been ranked 27th within the group of 42 countries we follow in terms of industrial production growth, 24 places below the position seen 10 years ago.
| Industrial Production Growth | Unit | 2000 | 2001 | 2002 | 2003 | 2004 | 2005 | 2006 | 2007 | 2008 | 2009 | 2010 | 2011 | 2012 | 2013 | 2014 | 2015 | 2016 | 2017 | 2018 | 2019 | 2020 |
| Australia | % | 1.36% | -0.662% | 4.47% | 2.65% | 1.36% | ||||||||||||||||
| Belarus | % | ... | ... | ... | ... | ... | ... | ... | ... | |||||||||||||
| China | % | ... | ... | ... | ... | ... | ... | ... | ... | ... | ... | ... | 8.26% | 6.10% | 6.07% | 6.68% | ... | ... | ... | |||
| Estonia | % | 3.91% | 0.301% | 3.40% | 4.01% | 4.78% | ||||||||||||||||
| Finland | % | -1.81% | -0.917% | 4.15% | 3.22% | 3.66% | ... | |||||||||||||||
| Germany | % | 1.35% | 1.45% | 1.32% | 2.71% | 0.961% | ||||||||||||||||
| Indonesia | % | ... | ... | ... | ... | ... | ... | ... | ... | ... | ... | ... | ... | ... | ... | ... | ... | ... | ... | ... | ... | ... |
| Japan | % | 1.89% | -1.30% | -0.299% | 4.23% | ... | ... | ... | ||||||||||||||
| Latvia | % | -1.10% | 3.61% | 5.39% | 8.35% | 1.47% | ||||||||||||||||
| Lithuania | % | 0.148% | 4.40% | 2.85% | 6.92% | 4.83% | ||||||||||||||||
| New Zealand | % | 2.50% | 1.33% | 1.92% | 1.97% | ... | ... | ... | ||||||||||||||
| Papua New Guinea | % | ... | ... | ... | ... | ... | ... | ... | ... | ... | ... | ... | ... | ... | ... | ... | ... | ... | ... | ... | ... | ... |
| Russia | % | 2.48% | 5.23% | 1.78% | 3.69% | 3.51% | ||||||||||||||||
| USA | % | 3.07% | -0.995% | -1.96% | 2.32% | 3.94% | ... |
 Helgi Library


