
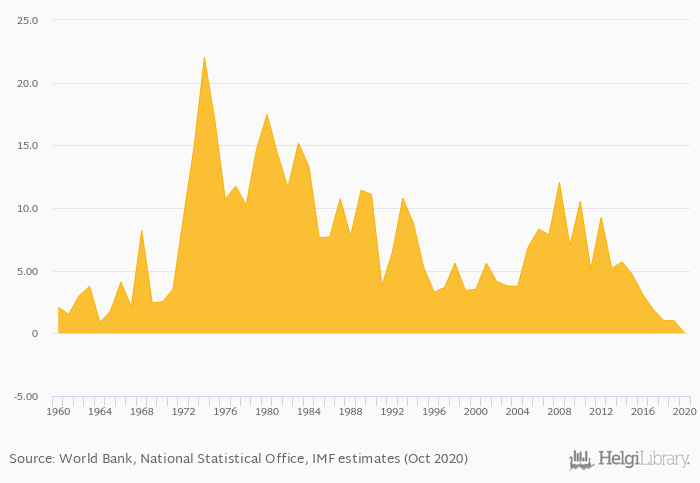
Average inflation measured by CPI fell 100% to -0.003% in Trinidad and Tobago in 2020, according to the National Statistical Office.
Historically, average inflation measured by CPI in Trinidad and Tobago reached an all time high of 22.0% in 1974 and an all time low of -0.003% in 2020. When compared to Trinidad and Tobago's main peers, average inflation measured by CPI in Guyana amounted to 0.964%, -1.62% in Puerto Rico, 49.8% in Suriname and 6,500% in Venezuela in 2020.
Trinidad and Tobago has been ranked 152nd within the group of 172 countries we follow in terms of average inflation measured by CPI, 139 places below the position seen 10 years ago.
| Inflation, CPI (Average) | Unit | 2007 | 2008 | 2009 | 2010 | 2011 | 2012 | 2013 | 2014 | 2015 | 2016 | 2017 | 2018 | 2019 | 2020 | 2021 | 2022 | 2023 | 2024 | 2025 | 2026 | 2027 |
| Brazil | % | 8.30% | 9.41% | 4.68% | 3.93% | 3.02% | ||||||||||||||||
| Colombia | % | 3.50% | 9.75% | 7.15% | 4.79% | 2.96% | ||||||||||||||||
| Dominican Republic | % | 8.24% | 9.02% | 5.68% | 4.34% | 4.03% | ||||||||||||||||
| Guyana | % | 3.32% | 7.59% | 7.63% | 5.01% | 3.78% | ||||||||||||||||
| Haiti | % | 15.9% | 26.8% | 21.2% | 13.5% | 12.9% | ||||||||||||||||
| Jamaica | % | 5.90% | 9.00% | 7.00% | 5.00% | 5.00% | ||||||||||||||||
| Puerto Rico | % | 2.41% | 4.39% | 3.52% | 2.39% | 2.44% | ||||||||||||||||
| Suriname | % | 59.1% | 47.6% | 27.2% | 14.0% | 10.8% | ||||||||||||||||
| Trinidad and Tobago | % | 1.50% | 5.05% | 4.64% | 3.22% | 2.67% | ||||||||||||||||
| USA | % | 4.69% | 8.05% | 3.51% | 2.23% | 2.04% | ||||||||||||||||
| Venezuela | % | 1,589% | 210% | 195% | ... | ... | ... | ... |
 Helgi Library


