
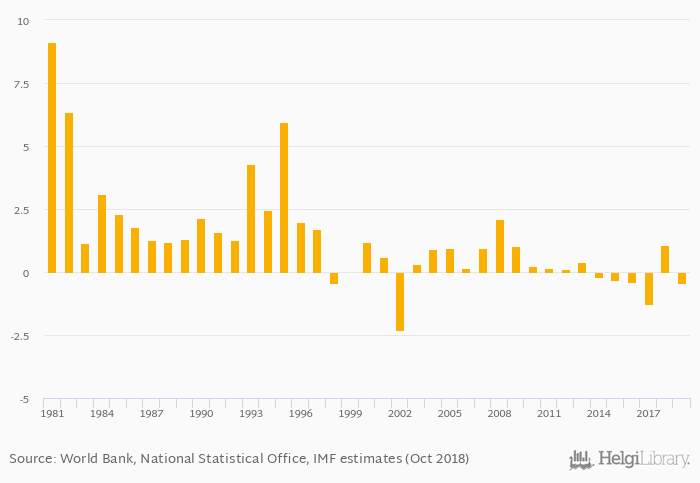
Average inflation measured by CPI rose 25.0% to 0.500% in Brunei in 2019, according to the National Statistical Office.
Historically, average inflation measured by CPI in Brunei reached an all time high of 0.500% in 2019 and an all time low of -0.023% in 2002. When compared to Brunei's main peers, average inflation measured by CPI in Indonesia amounted to 3.85%, 2.29% in Malaysia, 4.00% in Philippines and 4.00% in Vietnam in 2019.
Brunei has been ranked 172nd within the group of 172 countries we follow in terms of average inflation measured by CPI, 44 places below the position seen 10 years ago.
| Inflation, CPI (Average) | Unit | 2007 | 2008 | 2009 | 2010 | 2011 | 2012 | 2013 | 2014 | 2015 | 2016 | 2017 | 2018 | 2019 | 2020 | 2021 | 2022 | 2023 | 2024 | 2025 | 2026 | 2027 |
| Australia | % | 2.82% | 6.50% | 4.80% | 2.91% | 2.82% | ||||||||||||||||
| Brunei | % | 1.73% | 2.50% | 2.00% | 1.50% | 1.00% | ||||||||||||||||
| Cambodia | % | 2.92% | 5.21% | 3.82% | 3.04% | 3.04% | ||||||||||||||||
| China | % | 0.853% | 2.17% | 2.24% | 1.86% | 2.00% | ||||||||||||||||
| Indonesia | % | 1.56% | 4.63% | 5.50% | 3.17% | 3.04% | ||||||||||||||||
| Laos | % | 3.75% | 15.0% | 9.00% | 4.00% | 3.00% | ||||||||||||||||
| Malaysia | % | 2.48% | 3.23% | 2.81% | 2.37% | 2.40% | ||||||||||||||||
| Philippines | % | 3.93% | 5.32% | 4.34% | 3.12% | 3.00% | ||||||||||||||||
| Singapore | % | 2.31% | 5.54% | 3.00% | 2.01% | 1.48% | ||||||||||||||||
| Taiwan | % | 1.97% | 3.10% | 2.20% | 1.44% | 1.44% | ||||||||||||||||
| Thailand | % | 1.23% | 6.33% | 2.82% | 1.45% | 2.30% | ||||||||||||||||
| Vietnam | % | 1.83% | 3.76% | 3.92% | 3.50% | 3.50% |
 Helgi Library


