
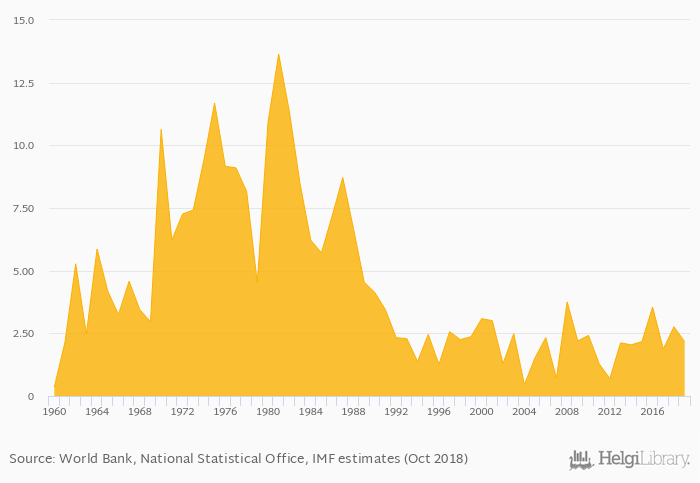
Average inflation measured by CPI rose 5.26% to 2.00% in Norway in 2019, according to the National Statistical Office.
Historically, average inflation measured by CPI in Norway reached an all time high of 2.00% in 2019 and an all time low of 0.004% in 1960. When compared to Norway's main peers, average inflation measured by CPI in Denmark amounted to 1.70%, 1.66% in Finland, 2.60% in Iceland and 1.75% in Sweden in 2019.
Norway has been ranked 136th within the group of 172 countries we follow in terms of average inflation measured by CPI, 30 places below the position seen 10 years ago.
| Inflation, CPI (Average) | Unit | 2007 | 2008 | 2009 | 2010 | 2011 | 2012 | 2013 | 2014 | 2015 | 2016 | 2017 | 2018 | 2019 | 2020 | 2021 | 2022 | 2023 | 2024 | 2025 | 2026 | 2027 |
| Australia | % | 2.82% | 6.50% | 4.80% | 2.91% | 2.82% | ||||||||||||||||
| Denmark | % | 1.94% | 7.20% | 3.80% | 2.40% | 2.20% | ||||||||||||||||
| Finland | % | 2.07% | 6.55% | 3.51% | 1.80% | 1.80% | ||||||||||||||||
| Germany | % | 3.21% | 8.46% | 7.19% | 3.53% | 2.56% | ||||||||||||||||
| Iceland | % | 4.46% | 8.43% | 6.71% | 4.14% | 2.72% | ||||||||||||||||
| Indonesia | % | 1.56% | 4.63% | 5.50% | 3.17% | 3.04% | ||||||||||||||||
| Netherlands | % | 2.83% | 12.0% | 8.00% | 2.70% | 2.30% | ||||||||||||||||
| New Zealand | % | 3.94% | 6.28% | 3.89% | 2.62% | 2.52% | ||||||||||||||||
| Norway | % | 3.48% | 4.70% | 3.80% | 2.70% | 2.50% | ||||||||||||||||
| Papua New Guinea | % | 4.49% | 6.60% | 5.40% | 4.90% | 4.60% | ||||||||||||||||
| Russia | % | 6.69% | 13.8% | 5.04% | 4.00% | 4.00% | ||||||||||||||||
| Sweden | % | 2.65% | 7.24% | 8.37% | 3.50% | 2.30% | ||||||||||||||||
| United Kingdom | % | 2.59% | 9.12% | 8.99% | 3.74% | 1.83% |
 Helgi Library


