
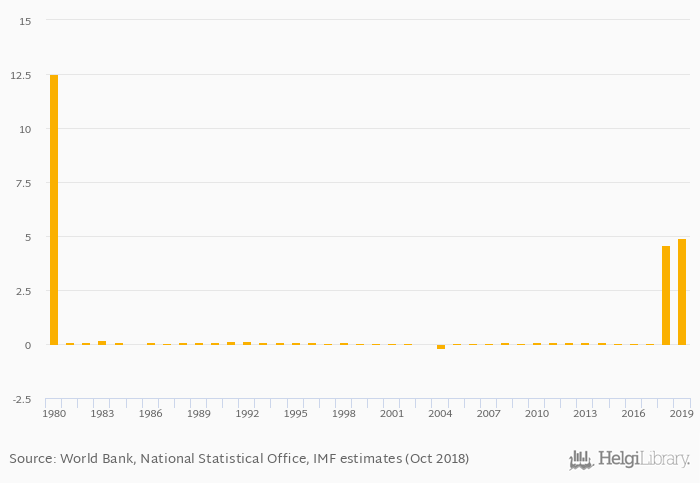
Average inflation measured by CPI rose 7.58% to 4.93% in Bhutan in 2019, according to the National Statistical Office.
Historically, average inflation measured by CPI in Bhutan reached an all time high of 12.5% in 1980 and an all time low of -0.181% in 2004. When compared to Bhutan's main peers, average inflation measured by CPI in Bangladesh amounted to 6.15%, 2.38% in China, 4.89% in India and 4.97% in Nepal in 2019.
Bhutan has been ranked 51st within the group of 172 countries we follow in terms of average inflation measured by CPI, 20 places above the position seen 10 years ago.
| Inflation, CPI (Average) | Unit | 2007 | 2008 | 2009 | 2010 | 2011 | 2012 | 2013 | 2014 | 2015 | 2016 | 2017 | 2018 | 2019 | 2020 | 2021 | 2022 | 2023 | 2024 | 2025 | 2026 | 2027 |
| Bangladesh | % | 5.56% | 6.15% | 9.05% | 6.80% | 6.00% | ||||||||||||||||
| Bhutan | % | 12.6% | 7.66% | 6.56% | 5.62% | 4.17% | ||||||||||||||||
| China | % | 0.853% | 2.17% | 2.24% | 1.86% | 2.00% | ||||||||||||||||
| India | % | 5.51% | 6.89% | 5.14% | 4.36% | 4.13% | ||||||||||||||||
| Japan | % | -0.235% | 1.99% | 1.39% | 1.04% | 0.996% | ||||||||||||||||
| Myanmar | % | 3.64% | 16.2% | 13.3% | 7.83% | 7.83% | ||||||||||||||||
| Nepal | % | 3.60% | 6.26% | 7.68% | 7.02% | 6.05% | ||||||||||||||||
| Pakistan | % | 8.90% | 12.1% | 19.9% | 10.0% | 7.71% | ||||||||||||||||
| Russia | % | 6.69% | 13.8% | 5.04% | 4.00% | 4.00% | ||||||||||||||||
| Sri Lanka | % | 5.96% | 48.2% | 29.5% | 5.98% | 5.87% | ||||||||||||||||
| USA | % | 4.69% | 8.05% | 3.51% | 2.23% | 2.04% |
 Helgi Library


