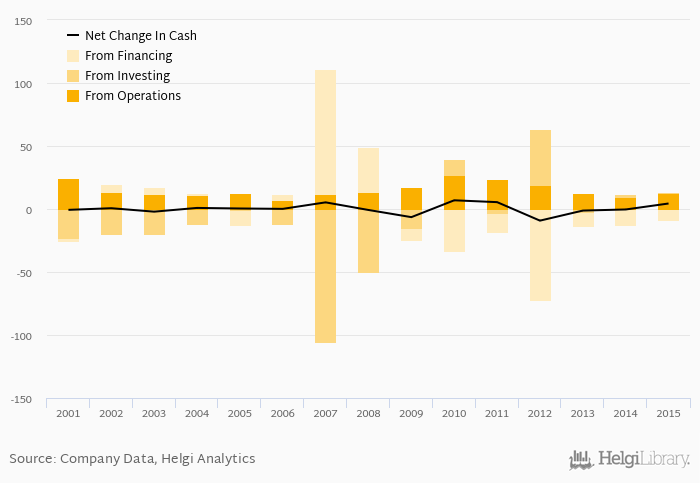
Intereuropa's operating cash flow stood at EUR 13.1 mil in 2015, up 32.5% when compared to the previous year. Historically, between 2001 - 2015, the firm’s operating cash flow reached a high of EUR 27.0 mil in 2010 and a low of EUR 7.07 mil in 2006.
Intereuropa's total investments stood at EUR 0.295 mil and accounted for 2.99% of sales in 2015. This is compared to an average of 1.60% as seen over the last five years.
Cash from financing amounted to EUR -8.99 mil, so the company generated EUR 4.37 mil net cash in 2015.
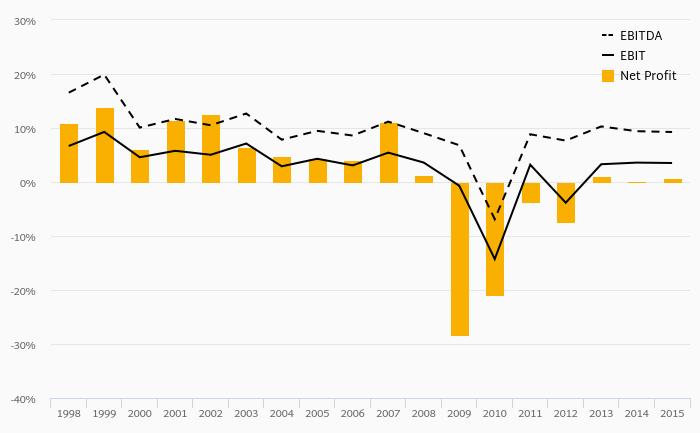
At the end of 2015, the company had a net debt of EUR 86.6 mil, or 6.95x of EBITDA and 0.585 of equity. Net working capital amounted to EUR 6.13 mil, or 4.56% of sales. The cash conversion cycle stood at -11.4 days in 2015. This is a deterioration compared to the previous year (-5.00 days), so Intereuropa’s working capital was tied up for 6.45 more days.
You can see all the company’s data at Intereuropa profile, or you can download a report on the company in the report section.
 Helgi Library