
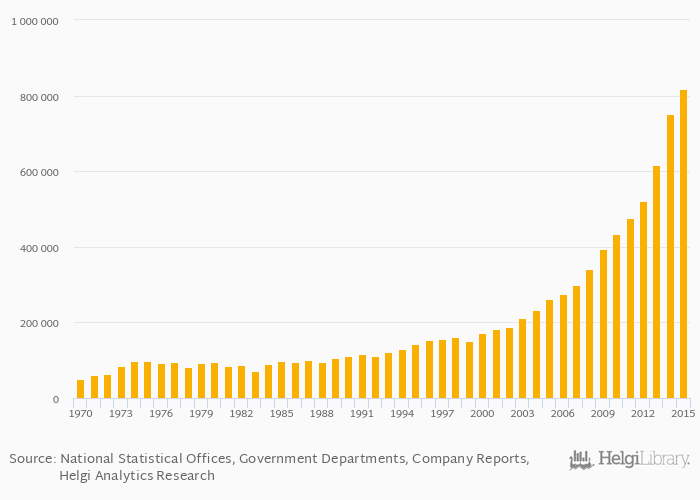
Iron ore production rose 8.83% to 816,782 kt in Australia in 2015, according to the National Statistical Office.
Historically, iron ore production in Australia reached an all time high of 816,782 kt in 2015 and an all time low of 51,189 kt in 1970.
Australia has been ranked 2nd within the group of 45 countries we follow in terms of iron ore production, 1 place above the position seen 10 years ago.
| Iron Ore Production | Unit | 1995 | 1996 | 1997 | 1998 | 1999 | 2000 | 2001 | 2002 | 2003 | 2004 | 2005 | 2006 | 2007 | 2008 | 2009 | 2010 | 2011 | 2012 | 2013 | 2014 | 2015 |
| Australia | kt | 394,403 | 433,452 | 477,330 | 519,859 | 615,523 | ||||||||||||||||
| Cambodia | kt | ... | ... | ... | ... | ... | ... | ... | ... | ... | ... | ... | ... | ... | ... | ... | ... | ... | ... | ... | ... | ... |
| Indonesia | kt | ... | 4,561 | 8,976 | 11,815 | 11,546 | 22,353 | |||||||||||||||
| Malaysia | kt | 1,470 | 3,558 | 8,078 | 12,144 | 12,134 | ||||||||||||||||
| New Zealand | kt | 2,093 | 2,439 | 2,357 | 2,395 | 3,157 | ||||||||||||||||
| Papua New Guinea | kt | ... | ... | ... | ... | ... | ... | ... | ... | ... | ... | ... | ... | ... | ... | ... | ... | ... | ... | ... | ... | ... |
| Philippines | kt | ... | ... | ... | ... | ... | ... | ... | ... | ... | ... | ... | ... | ... | ... | ... | ... | 293 | 216 | 827 | ||
| Singapore | kt | ... | ... | ... | ... | ... | ... | ... | ... | ... | ... | ... | ... | ... | ... | ... | ... | ... | ... | ... | ... | ... |
| Thailand | kt | 616 | 977 | 489 | 303 | 390 | ||||||||||||||||
| Vietnam | kt | ... | ... | 1,905 | 1,972 | 2,371 | 1,506 | 2,495 |
 Helgi Library


