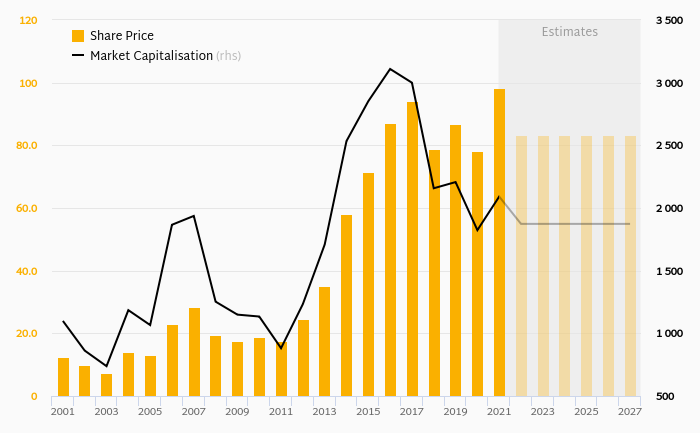
Jack in the Box stock traded at USD 98.4 per share at the end 2021 translating into a market capitalization of USD 2,091 mil. Since the end of 2016, the stock has appreciated by 12.9% representing an annual average growth of 2.46%.
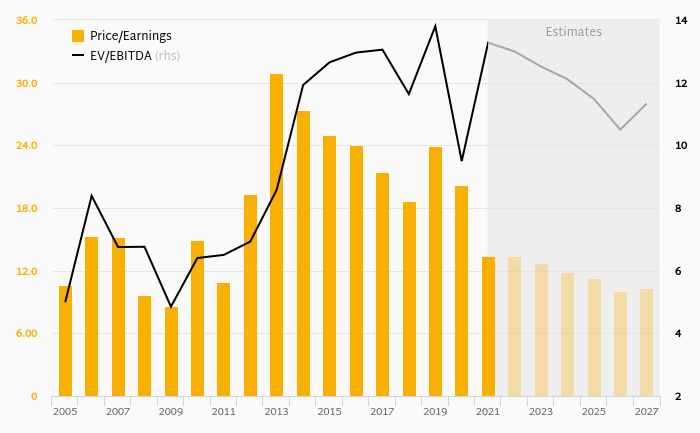
At the end of 2021, the firm traded at price to earnings of 13.4x. Over the last five years, this multiple achieved a high of 23.9x in 2019 and a low of 13.4x in 2021 with an average of 19.5x.
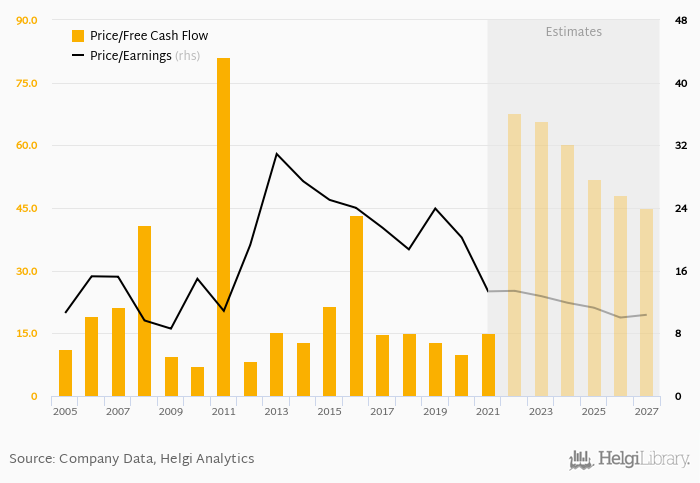
Regarding cash generated defined by the sum of net profit and depreciation, the stock traded at x at the end of 2021. When investments are excluded to get free cash flow, Jack in the Box traded at 15.2x.
At the end of 2021, the company had a net debt of USD 2,198 mil, or 6.80x of EBITDA and -280% of equity. The firm generated an average return on equity of -22.0% for its shareholders in the last five years and an average dividend yield of 1.76%.
You can see all the company’s data at Jack in the Box profile, or you can download a report on the company in the report section.
 Helgi Library