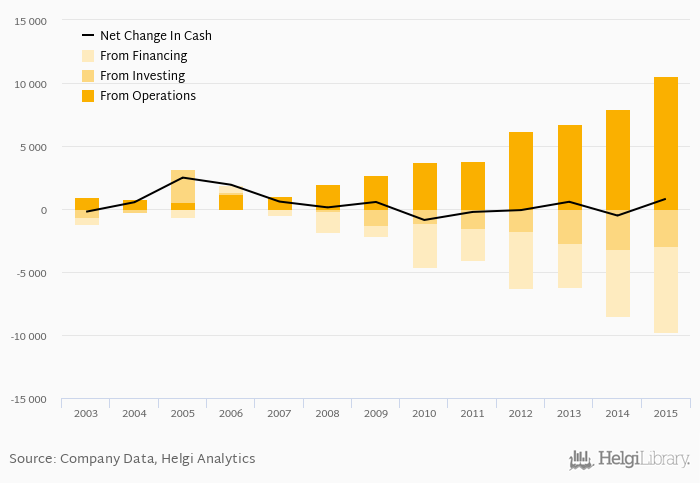
Lego Group's operating cash flow stood at DKK 10,559 mil in 2015, up 32.9% when compared to the previous year. Historically, between 2003 - 2015, the firm’s operating cash flow reached a high of DKK 10,559 mil in 2015 and a low of DKK 587 mil in 2005.
Lego Group's total investments stood at DKK -2,935 mil and accounted for 8.24% of sales in 2015. This is compared to an average of 9.07% as seen over the last five years.
Cash from financing amounted to DKK -6,816 mil, so the company generated DKK 808 mil net cash in 2015.
At the end of 2015, the company had a net debt of DKK -835 mil, or -0.063x of EBITDA and -0.047 of equity. Net working capital amounted to DKK 6,014 mil, or 16.8% of sales. Cash conversion cycle is negative and reached 50.7 days days in 2015. This means Lego Group generates revenue from customers before it has to pay its suppliers for inventory, among other things.
You can see all the company’s data at Lego Group profile, or you can download a report on the company in the report section.
 Helgi Library