
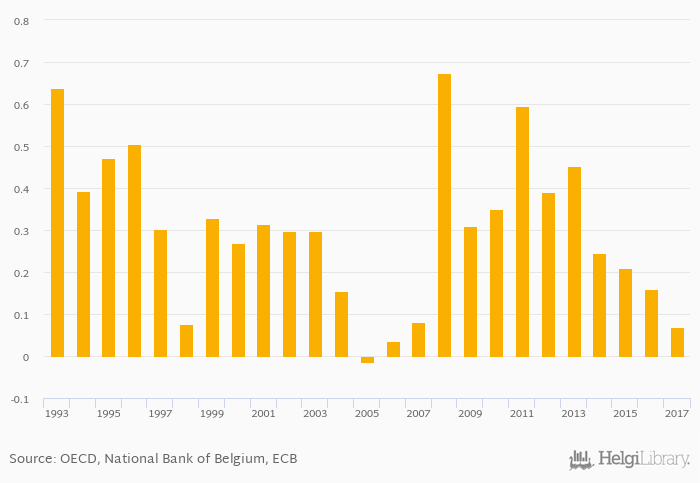
Loan loss provisions as a percentage of bank loans fell 57.1% to 0.069% in Belgium in 2017, according to the National Central Bank.
Historically, loan loss provisions as a percentage of bank loans in Belgium reached an all time high of 0.673% in 2008 and an all time low of -0.013% in 2005.
Belgium has been ranked 53rd within the group of 63 countries we follow in terms of loan loss provisions as a percentage of bank loans, 6 places below the position seen 10 years ago.
| Loan Loss Provisions (As % of Bank Loans) | Unit | 2001 | 2002 | 2003 | 2004 | 2005 | 2006 | 2007 | 2008 | 2009 | 2010 | 2011 | 2012 | 2013 | 2014 | 2015 | 2016 | 2017 | 2018 | 2019 | 2020 | 2021 |
| Austria | % | 0.338% | 0.114% | 0.158% | ... | ... | ... | ... | ||||||||||||||
| Belgium | % | 0.210% | 0.160% | 0.069% | ... | ... | ... | ... | ||||||||||||||
| Denmark | % | 0.189% | 0.098% | -0.008% | 0.039% | 0.078% | ... | |||||||||||||||
| France | % | ... | ... | ... | ... | ... | ... | ... | ... | |||||||||||||
| Germany | % | 0.105% | 0.247% | ... | ... | ... | ... | ... | ||||||||||||||
| Italy | % | 0.057% | 0.059% | 0.085% | ... | ... | ... | ... | ||||||||||||||
| Luxembourg | % | ... | ... | ... | ... | ... | ... | ... | ... | ... | ||||||||||||
| Netherlands | % | ... | ... | ... | ... | ... | ... | ... | ... | |||||||||||||
| Poland | % | 0.965% | 0.810% | 0.800% | 0.795% | 0.852% | ||||||||||||||||
| Spain | % | 0.783% | 0.640% | 0.626% | ... | ... | ... | ... | ||||||||||||||
| United Kingdom | % | ... | ... | ... | ... | ... | 0.910% | ... | ... | ... | ... | ... | ... |
 Helgi Library


