
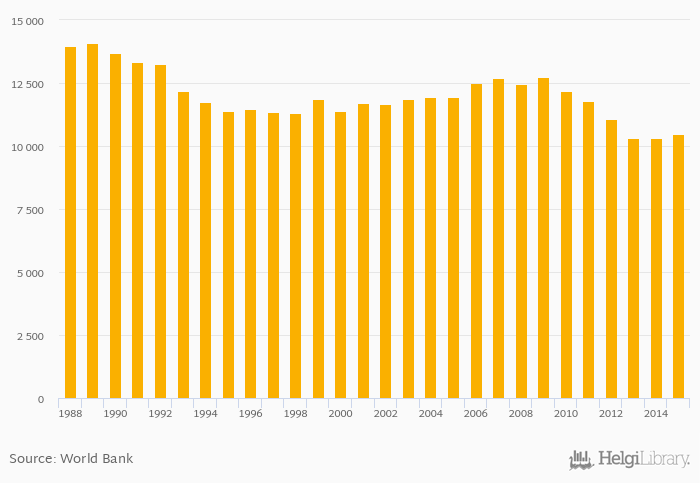
Military expenditure at constant USD prices from 2014 rose 1.39% to USD 10,476 mil in Netherlands in 2015, according to the SIPRI Military Expenditure Database.
Historically, military expenditure at constant USD prices from 2014 in Netherlands reached an all time high of USD 14,100 mil in 1989 and an all time low of USD 10,317 mil in 2013. When compared to Netherlands's main peers, military expenditure at constant USD prices from 2014 in Belgium amounted to USD 4,953 mil, USD 4,130 mil in Denmark, USD 47,046 mil in Germany and USD 59,730 mil in United Kingdom in 2015.
Netherlands has been ranked 21st within the group of 142 countries we follow in terms of military expenditure at constant USD prices from 2014, 2 places below the position seen 10 years ago.
| Military Expenditure (Constant 2014 USD) | Unit | 1995 | 1996 | 1997 | 1998 | 1999 | 2000 | 2001 | 2002 | 2003 | 2004 | 2005 | 2006 | 2007 | 2008 | 2009 | 2010 | 2011 | 2012 | 2013 | 2014 | 2015 |
| Austria | USD mil | 3,557 | 3,536 | 3,456 | 3,411 | 3,278 | ||||||||||||||||
| Belgium | USD mil | 5,926 | 5,675 | 5,476 | 5,415 | 5,244 | ||||||||||||||||
| Denmark | USD mil | 4,520 | 4,813 | 4,486 | 4,626 | 4,243 | ||||||||||||||||
| France | USD mil | 68,451 | 65,322 | 63,725 | 62,844 | 62,686 | ||||||||||||||||
| Germany | USD mil | 48,885 | 49,418 | 48,004 | 49,149 | 46,312 | ||||||||||||||||
| Ireland | USD mil | 1,407 | 1,341 | 1,271 | 1,204 | 1,197 | ||||||||||||||||
| Luxembourg | USD mil | 237 | 298 | 258 | 251 | 260 | ||||||||||||||||
| Netherlands | USD mil | 12,732 | 12,196 | 11,786 | 11,075 | 10,317 | ||||||||||||||||
| Norway | USD mil | 6,727 | 6,624 | 6,747 | 6,870 | 7,028 | ||||||||||||||||
| Poland | USD mil | 8,768 | 9,175 | 9,302 | 9,383 | 9,304 | ||||||||||||||||
| Sweden | USD mil | 5,922 | 6,409 | 6,026 | 6,152 | 6,188 | ||||||||||||||||
| United Kingdom | USD mil | 70,679 | 69,192 | 66,271 | 63,446 | 60,766 |
 Helgi Library


