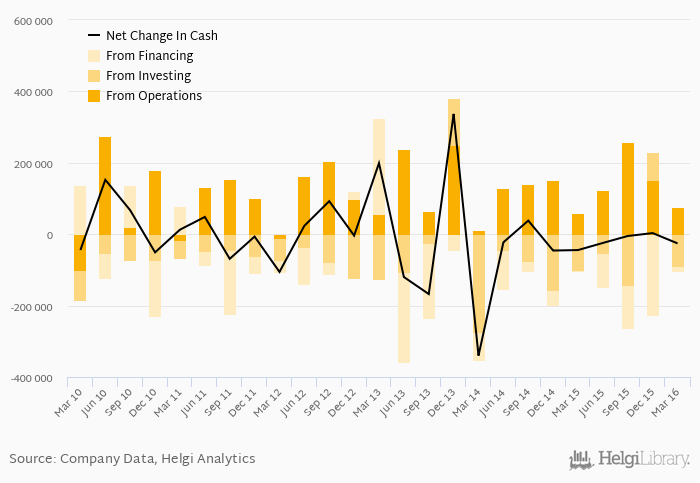
MOL's operating cash flow stood at HUF 77,543 mil in 1Q2016, up 30.8% when compared to the previous year. Historically, between 1Q2010 - 1Q2016, the firm’s operating cash flow reached a high of HUF 276,146 mil in 2Q2010 and a low of HUF -99,223 mil in 1Q2010.
MOL's total investments stood at HUF -88,210 mil and accounted for of sales in 1Q2016. This is compared to an average of
Severity: Warning
Message: Division by zero
Filename: models/Chunks_model.php
Line Number: 420
Cash from financing amounted to HUF -15,043 mil, so the company generated HUF -25,710 mil net cash in 1Q2016.
At the end of 1Q2016, the company had a net debt of HUF 735,273 mil, or 1.16x of EBITDA and 0.430 of equity. Net working capital amounted to HUF -92,487 mil, or -13.2% of sales. The cash conversion cycle stood at -15.2 days in 1Q2016. This is a deterioration compared to the previous year (-8.17 days), so MOL’s working capital was tied up for 7.03 more days.
You can see all the company’s data at MOL profile, or you can download a report on the company in the report section.
 Helgi Library