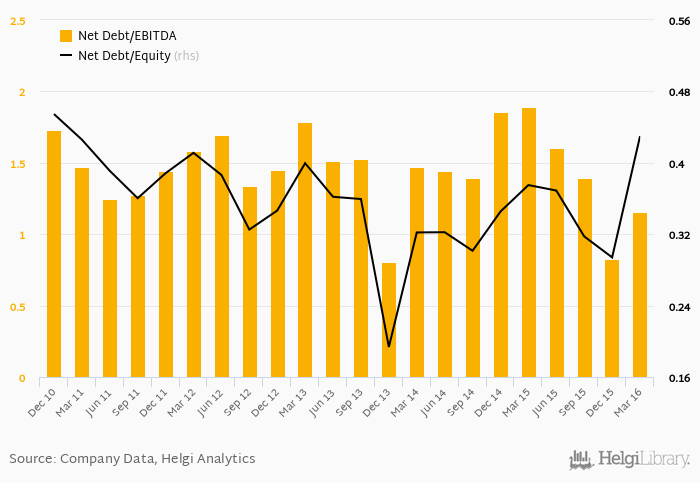
MOL's net debt stood at HUF 735,273 mil and accounted for 0.430 of equity at the end of 1Q2016. The ratio is up 0.055 pp compared to the previous year.
Historically, the firm’s net debt to equity reached a high of 0.572 in 1Q2010 and a low of 0.194 in 4Q2013 between 1Q2010 and 1Q2016. The average for the last five years was 0.350%.
Net debt to EBITDA was calculated at 1.16x at the end of the quarter. That is up from 1.47x seen in 2011-03-31. The ratio reached a high of 1.89x in 1Q2015 and a low of 0.803x in 4Q2013.
The company’s cost of funding amounted to 6.45% in 1Q2016, down which is above the 5-year of 6.79%. Funding costs have “eaten” some 1.17% of the operating profit generated in 2019.
You can see all the company’s data at MOL profile, or you can download a report on the company in the report section.
 Helgi Library