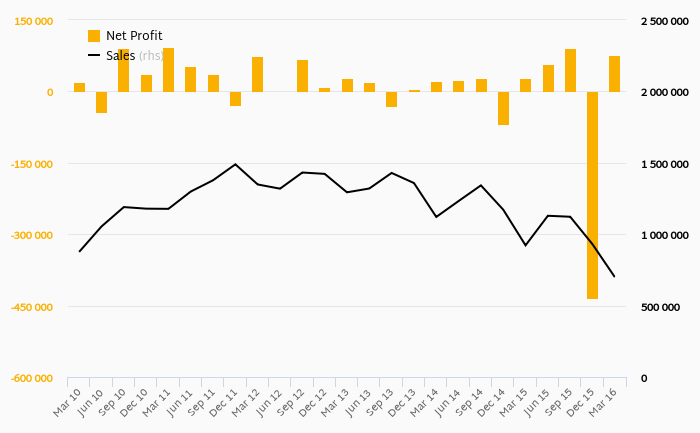
MOL made a net profit of HUF 77,177 mil in 1Q2016, up 165% compared to the previous year. Historically, between 1Q2010 and 1Q2016, the company's net profit reached a high of HUF 92,663 mil in 1Q2011 and a low of HUF -433,909 mil in 4Q2015.
The result implies a return on equity of -10.2% and a return on invested capital of -6.89% in 1Q2016. That is compared to an average of 2.84% and 1.85% over the last five years.
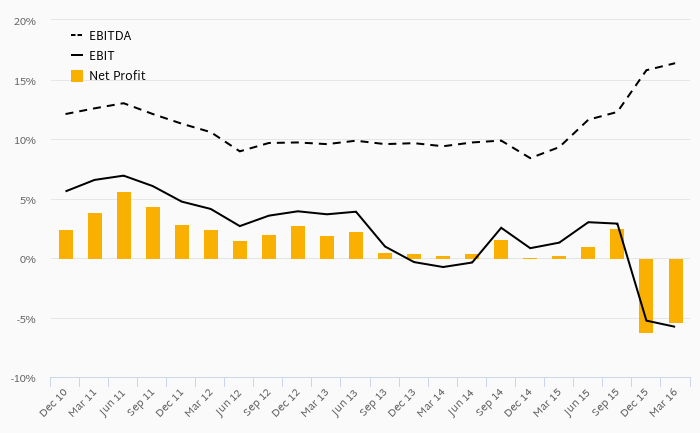
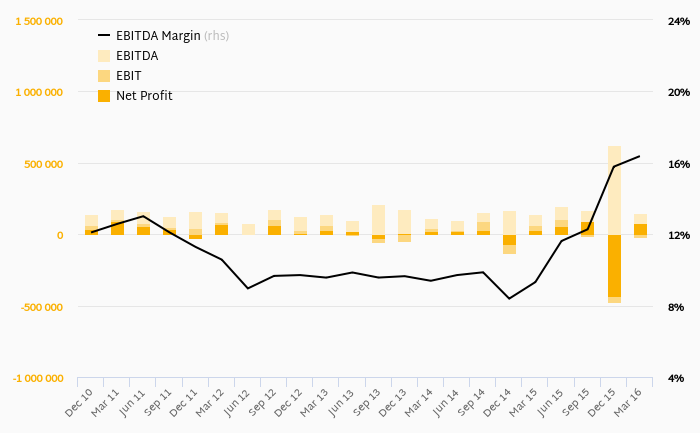
The company has been operating with average EBITDA margin of 10.8% in the last 5 years and an average net margin of 1.06%.
Since 1Q2011, the firm's net profit increased by -16.7% or an average of -3.59% a year.
You can see all the company’s data at MOL profile, or you can download a report on the company in the report section.
ROCE | Unit | Dec 2003 | Mar 2004 | Jun 2004 | Sep 2004 | Dec 2004 | Mar 2005 | Jun 2005 | Sep 2005 | Dec 2005 | Mar 2006 | Jun 2006 | Sep 2006 | Dec 2006 | Mar 2007 | Jun 2007 | Sep 2007 | Dec 2007 | Mar 2008 | Jun 2008 | Sep 2008 | Dec 2008 | Mar 2009 | Jun 2009 | Sep 2009 | Dec 2009 | Mar 2010 | Jun 2010 | Sep 2010 | Dec 2010 | Mar 2011 | Jun 2011 | Sep 2011 | Dec 2011 | Mar 2012 | Jun 2012 | Sep 2012 | Dec 2012 | Mar 2013 | Jun 2013 | Sep 2013 | Dec 2013 | Mar 2014 | Jun 2014 | Sep 2014 | Dec 2014 | Mar 2015 | Jun 2015 | Sep 2015 | Dec 2015 | Mar 2016 |
MOL | % | ... | ... | ... | ... | ... | ... | ... | ... | ... | ... | ... | ... | ... | ... | ... | ... | ... | ... | ... | ... | ... | ... | ... | ... | ... | ... | ... | ... | 2.64% | 0.133% | 0.400% | 1.45% | 3.37% | |||||||||||||||||
PGNiG | % | ... | ... | ... | ... | ... | ... | ... | ... | ... | ... | ... | ... | ... | ... | ... | ... | ... | ... | ... | ... | ... | ... | ... | ... | ... | ... | ... | ... | 4.95% | 7.04% | 7.13% | 7.88% | 7.10% | |||||||||||||||||
PKN | % | ... | ... | ... | ... | ... | ... | ... | ... | ... | ... | ... | ... | ... | ... | ... | ... | ... | ... | ... | ... | ... | ... | ... | ... | ... | ... | ... | ... | ... | ... | ... | ... | ... | ... | ... | ... | ... | ... | ... | ... | -14.9% | -17.7% | -16.6% | 4.67% | 5.42% | |||||
AVERAGE | % | ... | ... | ... | ... | ... | ... | ... | ... | ... | ... | ... | ... | ... | ... | ... | ... | ... | ... | ... | ... | ... | ... | ... | ... | ... | ... | ... | ... | 6.08% | 7.18% | 8.59% | 7.53% | 5.01% | 3.41% | 2.09% | 2.16% | 5.17% | 5.40% | 6.49% | 5.68% | 1.99% | 1.95% | -2.77% | -2.42% | -3.51% | -3.01% | 4.67% | 5.30% | 1.99% | 2.12% |