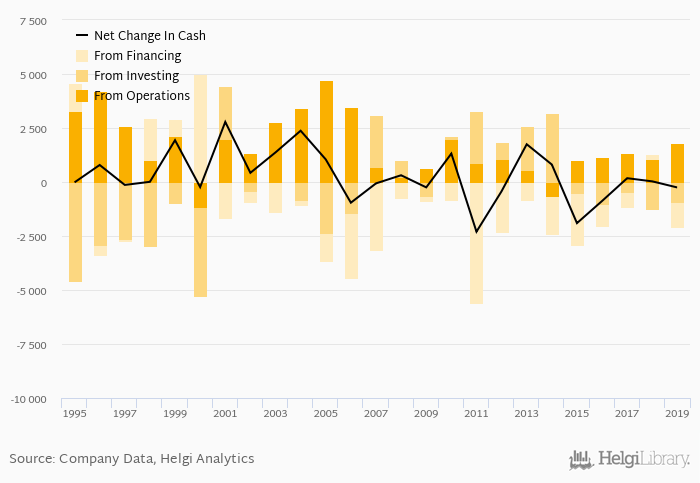
Motorola Solutions's operating cash flow stood at USD 1,823 mil in 2019, up 69.6% when compared to the previous year. Historically, between 1995 - 2019, the firm’s operating cash flow reached a high of USD 4,723 mil in 2005 and a low of USD -1,164 mil in 2000.
Motorola Solutions's total investments stood at USD -934 mil and accounted for 3.06% of sales in 2019. This is compared to an average of 3.12% as seen over the last five years.
Cash from financing amounted to USD -1,144 mil, so the company generated USD -255 mil net cash in 2019.
At the end of 2019, the company had a net debt of USD 4,747 mil, or 1.74x of EBITDA and -6.95% of equity. Net working capital amounted to USD 1,241 mil, or 15.7% of sales. Cash conversion cycle is negative and reached 49.1 days days in 2019. This means Motorola Solutions generates revenue from customers before it has to pay its suppliers for inventory, among other things.
You can see all the company’s data at Motorola Solutions profile, or you can download a report on the company in the report section.
 Helgi Library