
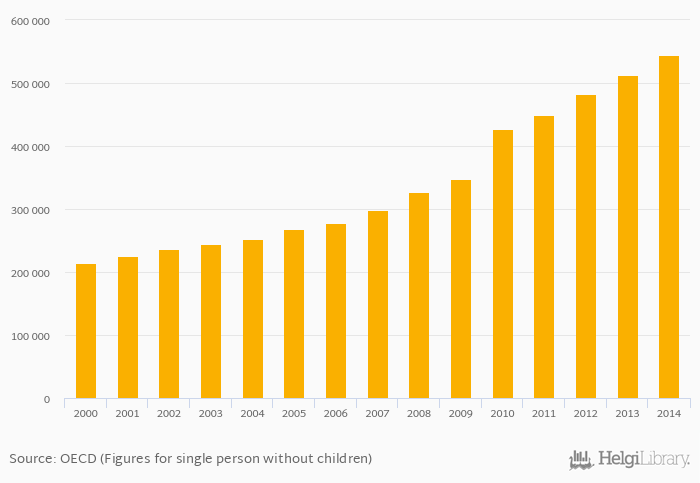
Net Average Monthly Wage (Local Currency) rose 0% to in Chile in 2015, according to OECD (Figures for single person without children).
Historically, Net Average Monthly Wage (Local Currency) in Chile reached an all time high of CLP 543,964 in 2014 and an all time low of CLP 214,702 in 2000.
| Net Average Monthly Wage (Local Currency) | Unit | 1994 | 1995 | 1996 | 1997 | 1998 | 1999 | 2000 | 2001 | 2002 | 2003 | 2004 | 2005 | 2006 | 2007 | 2008 | 2009 | 2010 | 2011 | 2012 | 2013 | 2014 |
| Argentina | ARS | ... | ... | ... | ... | ... | ... | ... | ... | ... | ... | ... | ... | ... | ... | ... | ... | ... | ... | ... | ... | ... |
| Bolivia | BOB | ... | ... | ... | ... | ... | ... | ... | ... | ... | ... | ... | ... | ... | ... | ... | ... | ... | ... | ... | ... | ... |
| Brazil | BRL | ... | ... | ... | ... | ... | ... | ... | ... | ... | ... | ... | ... | ... | ... | ... | ... | ... | ... | ... | ... | ... |
| Chile | CLP | ... | ... | ... | ... | ... | ... | 326,940 | 347,095 | 426,878 | 449,817 | 481,943 | ||||||||||
| Paraguay | PYG | ... | ... | ... | ... | ... | ... | ... | ... | ... | ... | ... | ... | ... | ... | ... | ... | ... | ... | ... | ... | ... |
| Peru | PEN | ... | ... | ... | ... | ... | ... | ... | ... | ... | ... | ... | ... | ... | ... | ... | ... | ... | ... | ... | ... | ... |
| Uruguay | UYU | ... | ... | ... | ... | ... | ... | ... | ... | ... | ... | ... | ... | ... | ... | ... | ... | ... | ... | ... | ... | ... |
 Helgi Library


