
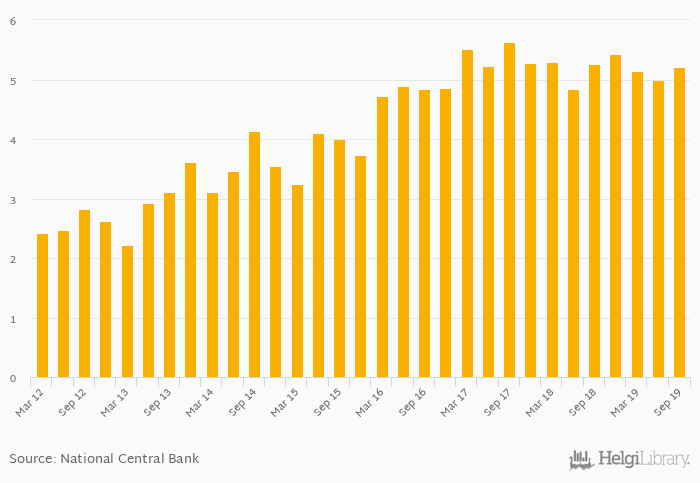
Non-performing loans as a share of bank loans fell 1.03% yoy to 5.20% in Botswana in 3Q2019, according to the National Central Bank. This is 4.15% more than in the previous quarter.
Historically, non-performing loans as a share of bank loans in Botswana reached an all time high of 5.63% in 3Q2017 and an all time low of 2.21% in 1Q2013.
Botswana has been ranked 20th within the group of 53 countries we follow in terms of non-performing loans as a share of bank loans, 20 places below the position seen 10 years ago.
| Non-Performing Loans (As % of Total Loans) | Unit | Dec 2018 | Mar 2019 | Jun 2019 | Sep 2019 | Dec 2019 | Mar 2020 | Jun 2020 | Sep 2020 | Dec 2020 | Mar 2021 | Jun 2021 | Sep 2021 | Dec 2021 | Mar 2022 | Jun 2022 | Sep 2022 | Dec 2022 | Mar 2023 | Jun 2023 | Sep 2023 | Dec 2023 |
| Angola | % | 15.7% | ... | ... | ... | ... | ... | ... | ||||||||||||||
| Botswana | % | 3.69% | 3.33% | 3.75% | 3.81% | 3.38% | ... | |||||||||||||||
| Dem. Republic of the Congo | % | 7.38% | 8.45% | 7.43% | 8.16% | 6.51% | ||||||||||||||||
| Lesotho | % | 4.59% | 4.41% | 4.31% | 4.18% | 4.11% | ... | |||||||||||||||
| Mozambique | % | 10.0% | 9.28% | 8.97% | 10.4% | 10.6% | ... | |||||||||||||||
| Namibia | % | 6.01% | 5.68% | 5.52% | 5.62% | 5.48% | ... | ... | ||||||||||||||
| South Africa | % | 4.46% | 4.79% | ... | ... | ... | ... | ... | ||||||||||||||
| Swaziland | % | 6.49% | 6.82% | 6.65% | 7.29% | 7.19% | ... | |||||||||||||||
| Tanzania | % | 7.27% | 6.81% | 6.43% | 6.08% | 4.93% | ... | ... | ||||||||||||||
| Zambia | % | 6.21% | 5.78% | 4.98% | 5.15% | 4.51% | ... | |||||||||||||||
| Zimbabwe | % | ... | ... | ... | ... | ... | ... | ... | ... | ... | ... | ... | ... | ... | ... | ... | ... | ... | ... | ... | ... | ... |
 Helgi Library


