
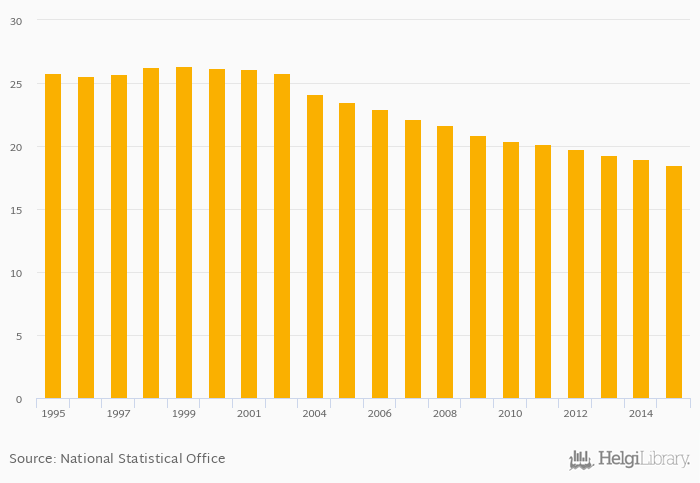
Number of passenger cars with a petrol engine rose 0% to 18.5 mil in Italy in 2016, according to the National Statistical Office.
Historically, number of passenger cars with a petrol engine in Italy reached an all time high of 26.4 mil in 1999 and an all time low of 18.5 mil in 2016.
Italy has been ranked 3rd within the group of 25 countries we follow in terms of number of passenger cars with a petrol engine, 1 place below the position seen 10 years ago.
| Number of Passenger Cars (Petrol Engine) | Unit | 1996 | 1997 | 1998 | 1999 | 2000 | 2001 | 2002 | 2003 | 2004 | 2005 | 2006 | 2007 | 2008 | 2009 | 2010 | 2011 | 2012 | 2013 | 2014 | 2015 | 2016 |
| Austria | mil | 1.99 | 2.00 | 2.00 | 2.01 | 2.02 | ... | |||||||||||||||
| Belgium | mil | 2.04 | 2.01 | 1.98 | 2.01 | 2.05 | ||||||||||||||||
| Croatia | mil | 0.938 | 0.923 | 0.849 | 0.834 | 0.814 | ||||||||||||||||
| France | mil | ... | ... | ... | ... | ... | ... | ... | ... | 10.2 | 9.75 | |||||||||||
| Germany | mil | ... | 30.5 | 30.5 | 30.2 | 30.0 | 29.8 | |||||||||||||||
| Hungary | mil | 2.36 | 2.31 | 2.28 | 2.27 | 2.27 | ||||||||||||||||
| Italy | mil | ... | 20.4 | 20.2 | 19.7 | 19.3 | 19.0 | ... | ||||||||||||||
| Slovenia | mil | ... | ... | 0.693 | 0.677 | 0.655 | 0.634 | 0.609 | ||||||||||||||
| Spain | mil | 10.7 | 10.5 | 10.3 | ... | 9.72 | ||||||||||||||||
| Switzerland | mil | 3.31 | 3.30 | 3.28 | 3.24 | 3.24 |
 Helgi Library


