
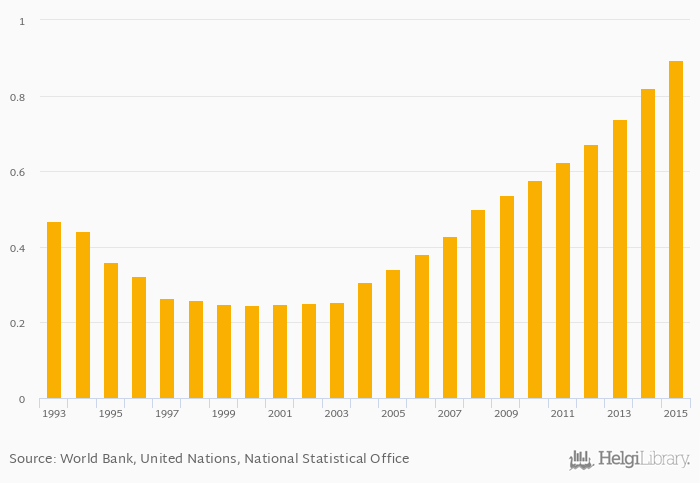
Number of passenger cars rose 8.98% to 0.895 mil in Georgia in 2015, according to the National Statistical Office.
Historically, number of passenger cars in Georgia reached an all time high of 0.895 mil in 2015 and an all time low of 0.245 mil in 2000.
Georgia has been ranked 74th within the group of 137 countries we follow in terms of number of passenger cars, 14 places above the position seen 10 years ago.
| Number of Passenger Cars | Unit | 1999 | 2000 | 2001 | 2002 | 2003 | 2004 | 2005 | 2006 | 2007 | 2008 | 2009 | 2010 | 2011 | 2012 | 2013 | 2014 | 2015 | 2016 | 2017 | 2018 | 2019 |
| Armenia | mil | ... | ... | ... | ... | ... | ... | ... | ... | ... | ... | ... | ... | ... | ... | ... | ... | ... | ... | ... | ... | ... |
| Azerbaijan | mil | 1.05 | 1.10 | 1.13 | 1.17 | 1.21 | ||||||||||||||||
| Bulgaria | mil | 2.91 | 3.01 | 3.16 | 3.18 | 3.23 | ||||||||||||||||
| China | mil | ... | ... | ... | ... | 101 | 117 | 136 | 139 | 146 | ||||||||||||
| Georgia | mil | 0.738 | 0.821 | 0.895 | 0.911 | 0.946 | ||||||||||||||||
| Germany | mil | 43.9 | 44.4 | 45.1 | 44.9 | 45.0 | ||||||||||||||||
| Greece | mil | 5.12 | 5.10 | 5.10 | 5.15 | 5.18 | ||||||||||||||||
| Iran | mil | ... | ... | ... | ... | ... | ... | 11.3 | 12.0 | 12.7 | 13.0 | 13.4 | ||||||||||
| Iraq | mil | ... | ... | ... | ... | ... | ... | 1.44 | 1.55 | 1.70 | 1.73 | 1.79 | ||||||||||
| Japan | mil | 60.0 | 60.7 | 61.0 | 61.2 | 61.4 | ||||||||||||||||
| Russia | mil | ... | ... | ... | ... | ... | 41.2 | 43.4 | 44.3 | 45.3 | 46.5 | |||||||||||
| Turkey | mil | 9.28 | 9.86 | 10.6 | 10.7 | 11.0 | ||||||||||||||||
| USA | mil | 120 | 121 | 122 | 121 | 120 |
 Helgi Library


