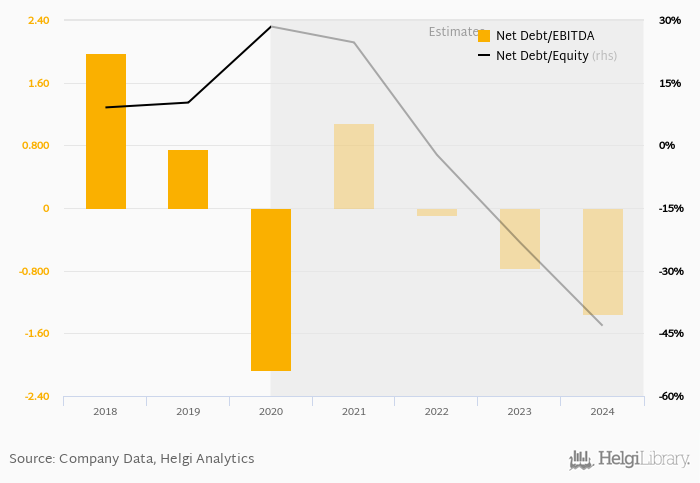
Nusco's net debt stood at EUR 3.60 mil and accounted for 28.4% of equity at the end of 2020. The ratio is up 18.2 pp compared to the previous year.
Historically, the firm’s net debt to equity reached a high of 67.1% in 2013 and a low of 9.07% in 2018 between 2011 and 2020. The average for the last five years was 22.1%.
Net debt to EBITDA was calculated at -2.07x at the end of the year.
Severity: Warning
Message: A non-numeric value encountered
Filename: src/Environment.php(358) : eval()'d code
Line Number: 19607
The company’s cost of funding amounted to in 2020,
Severity: Warning
Message: Division by zero
Filename: models/Chunks_model.php
Line Number: 610
Severity: Warning
Message: A non-numeric value encountered
Filename: src/Environment.php(358) : eval()'d code
Line Number: 19652
You can see all the company’s data at Nusco profile, or you can download a report on the company in the report section.
 Helgi Library