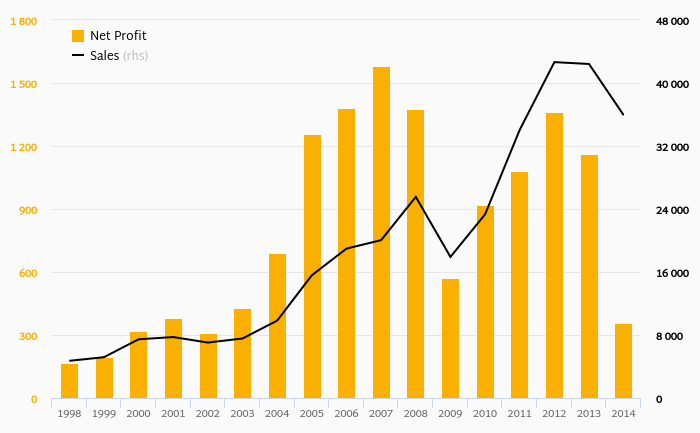
OMV Group made a net profit of EUR 357 mil in 2014, down 69.3% compared to the previous year. Historically, between 1998 and 2014, the company's net profit reached a high of EUR 1,579 mil in 2007 and a low of EUR 169 mil in 1998.
The result implies a return on equity of 2.45% and a return on invested capital of 1.40% in 2014. That is compared to an average of 7.52% and 4.29% over the last five years.
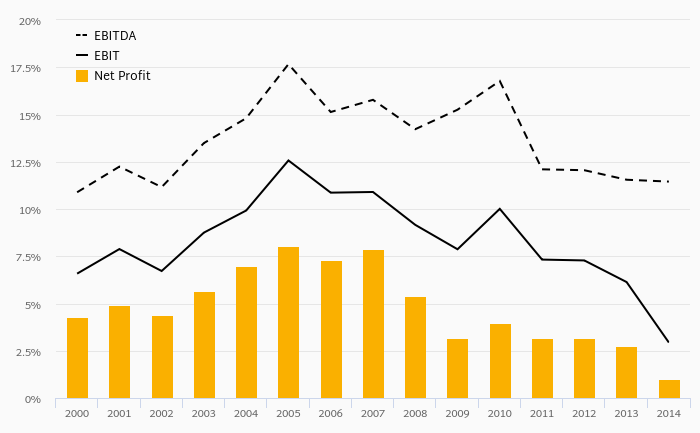
The company has been operating with average EBITDA margin of 12.8% in the last 5 years and an average net margin of 2.81%.
Since 2009, the firm's net profit increased by -37.6% or an average of -9.00% a year.
As far as OMV Group's peers are concerned, PKN generated ROE of -24.2% and ROCE of -16.4% in 2014. MOL's profitability reached 0.186% and 0.128%, respectively. OMV Petrom operated with 7.84% and 5.73% returns in 2014.
You can see all the company’s data at OMV Group profile, or you can download a report on the company in the report section.
 Helgi Library