
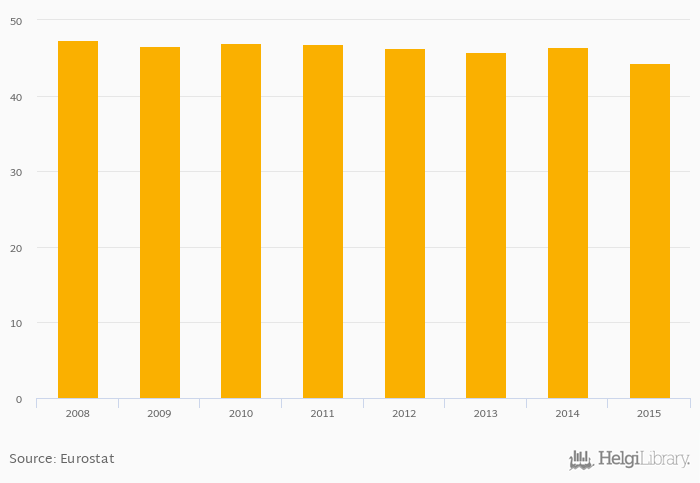
Personnel in the Criminal Justice System by Sex - Personnel in adult prison - Total (per 100,000 inhabitants) fell 4.38% to 44.4 Per hundred thousand inhabitants in Austria in 2015, according to Eurostat.
Historically, Personnel in the Criminal Justice System by Sex - Personnel in adult prison - Total (per 100,000 inhabitants) in Austria reached an all time high of 47.4 Per hundred thousand inhabitants in 2008 and an all time low of 44.4 Per hundred thousand inhabitants in 2015.
Austria has been ranked 22nd within the group of 27 countries we follow in terms of Personnel in the Criminal Justice System by Sex - Personnel in adult prison - Total (per 100,000 inhabitants).
| Personnel in the Criminal Justice System by Sex - Personnel in adult prison - Total (per 100,000 inhabitants) | Unit | 1995 | 1996 | 1997 | 1998 | 1999 | 2000 | 2001 | 2002 | 2003 | 2004 | 2005 | 2006 | 2007 | 2008 | 2009 | 2010 | 2011 | 2012 | 2013 | 2014 | 2015 |
| Austria | Per hundred thousand inhabitants | ... | ... | ... | ... | ... | ... | ... | ... | ... | ... | ... | ... | ... | 46.6 | 46.9 | 46.8 | 46.3 | 45.8 | |||
| Belgium | Per hundred thousand inhabitants | ... | ... | ... | ... | ... | ... | ... | ... | ... | ... | ... | ... | ... | 76.8 | 75.0 | 76.3 | 75.1 | 77.1 | ... | ||
| Czechia | Per hundred thousand inhabitants | ... | ... | ... | ... | ... | ... | ... | ... | ... | ... | ... | ... | ... | 103 | 99.9 | 101 | 104 | 101 | |||
| France | Per hundred thousand inhabitants | ... | ... | ... | ... | ... | ... | ... | ... | ... | ... | ... | ... | ... | 40.1 | ... | ... | ... | 42.8 | |||
| Germany | Per hundred thousand inhabitants | ... | ... | ... | ... | ... | ... | ... | ... | ... | ... | ... | ... | ... | 44.7 | 45.0 | 44.6 | 45.1 | 45.3 | ... | ||
| Hungary | Per hundred thousand inhabitants | ... | ... | ... | ... | ... | ... | ... | ... | ... | ... | ... | ... | ... | 71.2 | 73.9 | 73.6 | 75.3 | 72.9 | |||
| Italy | Per hundred thousand inhabitants | ... | ... | ... | ... | ... | ... | ... | ... | ... | ... | ... | ... | ... | 77.6 | 76.4 | 75.1 | 75.8 | 74.7 | |||
| Poland | Per hundred thousand inhabitants | ... | ... | ... | ... | ... | ... | ... | ... | ... | ... | ... | ... | ... | 79.7 | 80.0 | 80.0 | 80.1 | 80.2 | |||
| Slovakia | Per hundred thousand inhabitants | ... | ... | ... | ... | ... | ... | ... | ... | ... | ... | ... | ... | ... | 92.4 | 92.4 | 93.1 | 92.0 | 92.2 | |||
| Slovenia | Per hundred thousand inhabitants | ... | ... | ... | ... | ... | ... | ... | ... | ... | ... | ... | ... | ... | 34.0 | 35.6 | 36.3 | 35.0 | 34.5 | |||
| Switzerland | Per hundred thousand inhabitants | ... | ... | ... | ... | ... | ... | ... | ... | ... | ... | ... | ... | ... | ... | ... | ... | 47.9 | ... |
 Helgi Library


