
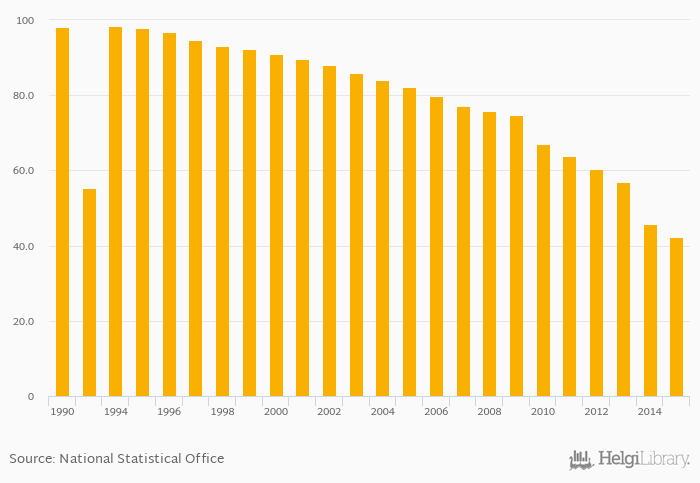
Petrol passenger cars as a share of total cars fell 7.27% to 42.3% in Latvia in 2015, according to the National Statistical Office.
Historically, petrol passenger cars as a share of total cars in Latvia reached an all time high of 98.3% in 1994 and an all time low of 42.3% in 2015.
Latvia has been ranked 21st within the group of 26 countries we follow in terms of petrol passenger cars as a share of total cars, 11 places below the position seen 10 years ago.
| Petrol Passenger Cars (As % of Total Cars) | Unit | 1996 | 1997 | 1998 | 1999 | 2000 | 2001 | 2002 | 2003 | 2004 | 2005 | 2006 | 2007 | 2008 | 2009 | 2010 | 2011 | 2012 | 2013 | 2014 | 2015 | 2016 |
| Belarus | % | ... | ... | ... | ... | ... | ... | ... | ... | ... | ... | ... | ... | ... | ... | ... | ... | ... | ... | ... | ... | ... |
| China | % | ... | ... | ... | ... | ... | ... | ... | ... | ... | ... | ... | ... | ... | ... | ... | ... | ... | ... | ... | ... | ... |
| Estonia | % | ... | 75.2% | 73.2% | 70.5% | 67.8% | 65.7% | |||||||||||||||
| Finland | % | 92.6% | 92.4% | 92.5% | 93.0% | 93.3% | ||||||||||||||||
| Germany | % | ... | 72.1% | 70.9% | 69.5% | 68.3% | 67.2% | |||||||||||||||
| Japan | % | ... | ... | ... | ... | ... | ... | ... | ... | ... | ... | ... | ... | ... | ... | ... | ... | ... | ... | ... | ... | ... |
| Latvia | % | 67.0% | 63.9% | 60.5% | 57.0% | 45.6% | ||||||||||||||||
| Lithuania | % | ... | ... | ... | ... | ... | ... | ... | ... | ... | ... | ... | ... | ... | ... | ... | ... | ... | 41.5% | 28.6% | ||
| Poland | % | ... | 61.0% | 60.1% | 57.7% | 56.5% | 55.5% | |||||||||||||||
| Russia | % | ... | ... | ... | ... | ... | ... | ... | ... | ... | ... | ... | ... | ... | ... | ... | ... | ... | ... | ... | ... | ... |
| USA | % | ... | ... | ... | ... | ... | ... | ... | ... | ... | ... | ... | ... | ... | ... | ... | ... | ... | ... | ... | ... | ... |
| Ukraine | % | ... | ... | ... | ... | ... | ... | ... | ... | ... | ... | ... | ... | ... | ... | ... | ... | ... | ... | ... | ... | ... |
 Helgi Library


