
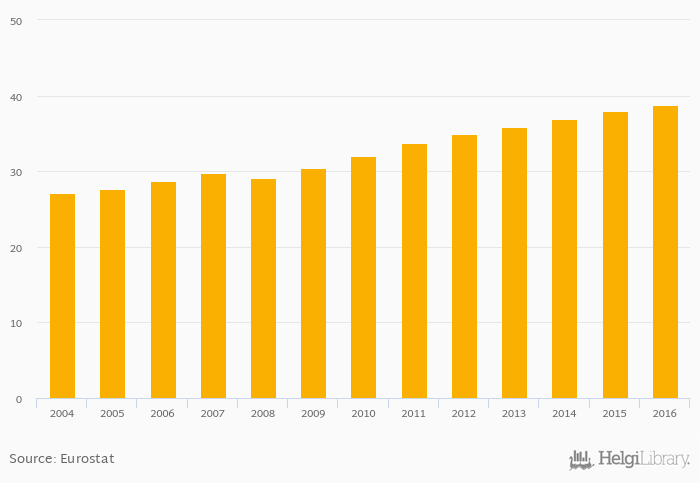
Population by Educational Attainment Level - From 18 to 74 years - Tertiary education (levels 5-8) - Total rose 2.11% to 38.8% in the United Kingdom in 2016, according to Eurostat.
Historically, Population by Educational Attainment Level - From 18 to 74 years - Tertiary education (levels 5-8) - Total in the United Kingdom reached an all time high of 38.8% in 2016 and an all time low of 27.1% in 2004. When compared to United Kingdom's main peers, Population by Educational Attainment Level - From 18 to 74 years - Tertiary education (levels 5-8) - Total in Belgium amounted to 33.4%, 30.9% in France, 25.4% in Germany and 37.6% in Ireland in 2016.
United Kingdom has been ranked 1st within the group of 32 countries we follow in terms of Population by Educational Attainment Level - From 18 to 74 years - Tertiary education (levels 5-8) - Total, 4 places above the position seen 10 years ago.
| Population by Educational Attainment Level - From 18 to 74 years - Tertiary education (levels 5-8) - Total | Unit | 1996 | 1997 | 1998 | 1999 | 2000 | 2001 | 2002 | 2003 | 2004 | 2005 | 2006 | 2007 | 2008 | 2009 | 2010 | 2011 | 2012 | 2013 | 2014 | 2015 | 2016 |
| Austria | % | ... | ... | ... | ... | ... | ... | ... | ... | 16.7% | 16.7% | 17.2% | 17.9% | 27.3% | ||||||||
| Belgium | % | ... | ... | ... | ... | ... | ... | ... | ... | 30.7% | 30.4% | 31.3% | 31.4% | 32.7% | ||||||||
| Canada | % | ... | ... | ... | ... | ... | ... | ... | ... | ... | ... | ... | ... | ... | ... | ... | ... | ... | ... | ... | ... | ... |
| France | % | ... | ... | ... | ... | ... | ... | ... | ... | 25.9% | 26.5% | 27.5% | 28.8% | 29.7% | ||||||||
| Germany | % | ... | ... | ... | ... | ... | ... | ... | ... | 23.3% | 24.2% | 24.8% | 25.3% | 24.0% | ||||||||
| Iceland | % | ... | ... | ... | ... | ... | ... | ... | ... | 26.3% | 27.2% | 28.6% | 29.4% | 30.2% | ||||||||
| Ireland | % | ... | ... | ... | ... | ... | ... | ... | ... | 33.0% | 33.4% | 34.9% | 36.4% | 35.9% | ||||||||
| Italy | % | ... | ... | ... | ... | ... | ... | ... | ... | 12.5% | 12.7% | 13.4% | 14.0% | 14.5% | ||||||||
| Luxembourg | % | ... | ... | ... | ... | ... | ... | ... | ... | 30.3% | 31.9% | 33.7% | 35.7% | 39.8% | ||||||||
| Netherlands | % | ... | ... | ... | ... | ... | ... | ... | ... | 28.1% | 28.2% | 28.8% | 29.5% | 29.9% | ||||||||
| Poland | % | ... | ... | ... | ... | ... | ... | ... | ... | 19.6% | 20.4% | 21.5% | 22.5% | 23.7% | ||||||||
| Spain | % | ... | ... | ... | ... | ... | ... | ... | ... | 27.2% | 28.1% | 28.7% | 29.6% | 30.3% | ||||||||
| United Kingdom | % | ... | ... | ... | ... | ... | ... | ... | ... | 32.0% | 33.7% | 34.9% | 35.9% | 36.9% |
 Helgi Library


