
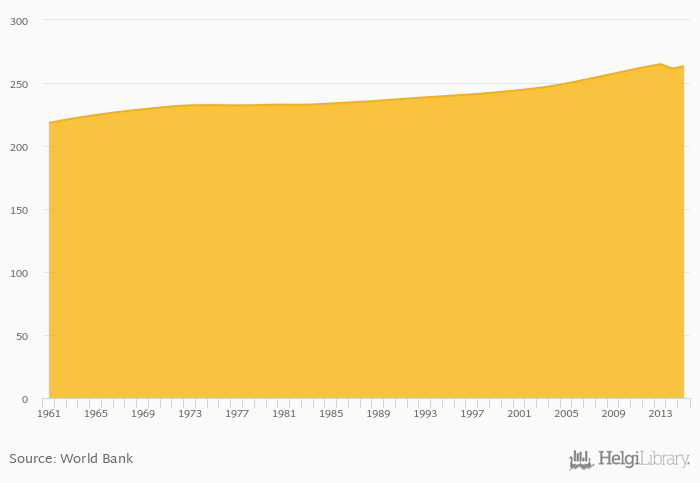
Population density rose 0.707% to 263 km per capita in the United Kingdom in 2015, according to Faostat.
Historically, population density in the United Kingdom reached an all time high of 265 km per capita in 2013 and an all time low of 218 km per capita in 1961. When compared to United Kingdom's main peers, population density in Belgium amounted to 367 km per capita, 120 km per capita in France, 232 km per capita in Germany and 66.6 km per capita in Ireland in 2015.
United Kingdom has been ranked 27th within the group of 177 countries we follow in terms of population density, 1 place above the position seen 10 years ago.
| Population Density | Unit | 1995 | 1996 | 1997 | 1998 | 1999 | 2000 | 2001 | 2002 | 2003 | 2004 | 2005 | 2006 | 2007 | 2008 | 2009 | 2010 | 2011 | 2012 | 2013 | 2014 | 2015 |
| Austria | km per capita | 101 | 101 | 102 | 102 | 103 | ||||||||||||||||
| Belgium | km per capita | ... | ... | ... | ... | ... | 357 | 361 | 365 | 368 | 369 | |||||||||||
| Canada | km per capita | 3.70 | 3.74 | 3.78 | 3.82 | 3.87 | ||||||||||||||||
| France | km per capita | 118 | 119 | 119 | 120 | 120 | ||||||||||||||||
| Germany | km per capita | 235 | 235 | 235 | 231 | 231 | ||||||||||||||||
| Iceland | km per capita | 3.18 | 3.17 | 3.18 | 3.20 | 3.23 | ||||||||||||||||
| Ireland | km per capita | 65.8 | 66.2 | 66.4 | 66.6 | 66.7 | ||||||||||||||||
| Italy | km per capita | 201 | 202 | 202 | 202 | 205 | ||||||||||||||||
| Luxembourg | km per capita | ... | ... | ... | ... | ... | 192 | 196 | 200 | 205 | 210 | |||||||||||
| Netherlands | km per capita | 490 | 493 | 495 | 497 | 498 | ||||||||||||||||
| Poland | km per capita | 125 | 125 | 126 | 126 | 126 | ||||||||||||||||
| Spain | km per capita | 92.9 | 93.4 | 93.7 | 93.8 | 93.5 | ||||||||||||||||
| United Kingdom | km per capita | 257 | 259 | 261 | 263 | 265 |
 Helgi Library


